By now you should be familiar with the design task. We’ve compiled some simple “experimental” visualizations to provide both a starting place and to give you an idea of what works and what doesn’t when comparing adjacency matrices in this context.
Here are some examples of the visualization tools that we’ve come up with to help with the problem. If you want to examine these experiments more closely, download the linked file, download and install Processing, and open the associated files. If you are just interested in the raw data, look at the .csvs in the data folder of the above file. The matrices are stored in blocks of nxn (where n is the number of nodes) cells with 0’s in the diagonal (representing that the strength of association from a node to itself is unknown/undefined). Each of the .csv represents a different venue. The .xlsx file presents all of the venues together so you can gauge relative scales.
Experiment one: The Asterisk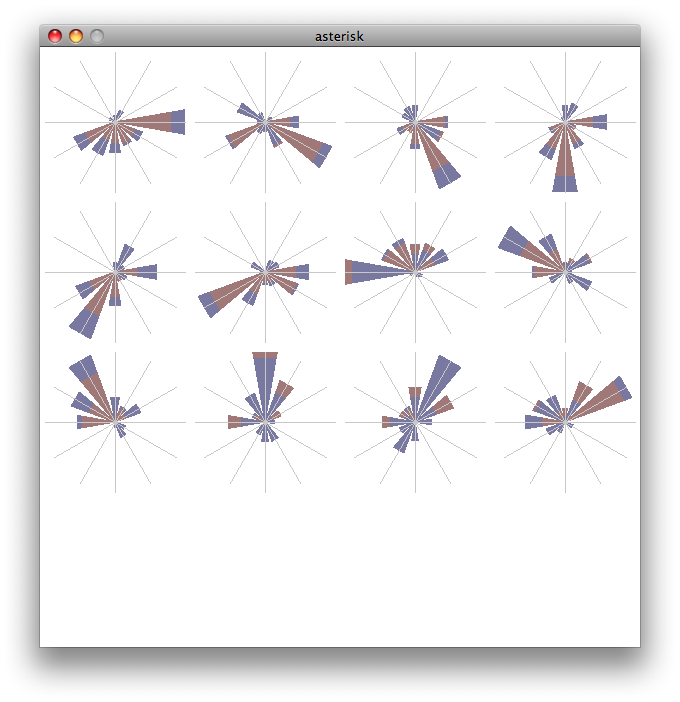
Similar to a radar plot, the asterisk measures the association strength along a different spoke for each member. The “fan” approach widens these bars to make them easier to see.
Experiment two: The CompareMat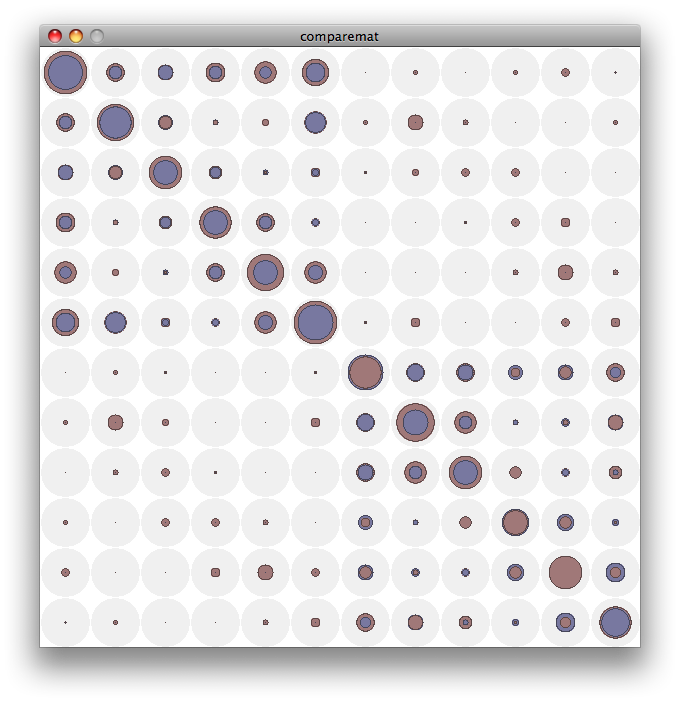
Overlays the adjacency matrices, represent strength by the radius of a circle. Smaller circles are always drawn on top of the larger ones so there is no missing information.
Experiment three: The Golfball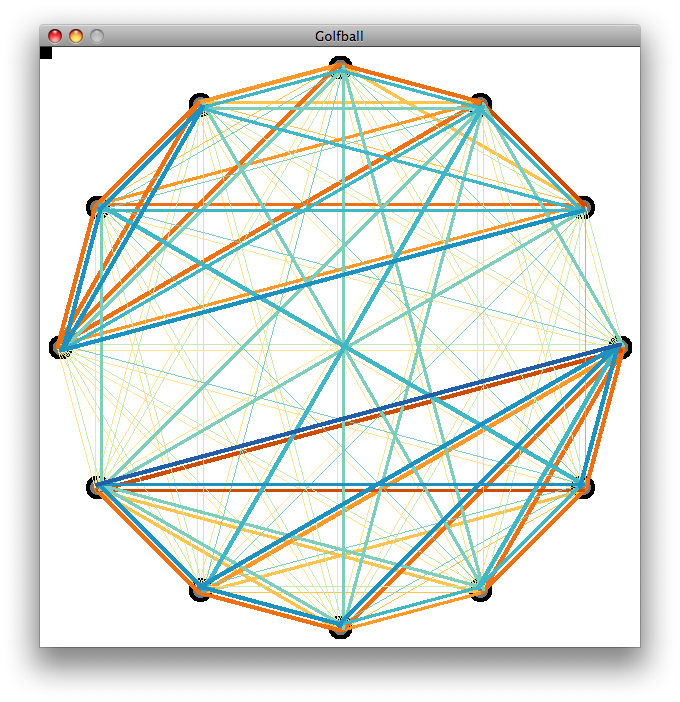
Creates a graph of all the nodes in the matrix, represents the connection between them by the width of the edges. Of course, fully connected graphs of any significant size can be hard to parse…
Experiment four: The Spokes Graph
Represents each node separately as a line in a table, with the ability to highlight sections of the graph to see specific vertices.
As you can tell, none of these designs is perfect, and all of them could use some work even if they are in fact somehow the right way of looking at these data. For more discussion consult this page and the assignment page.