
main-midtermstats
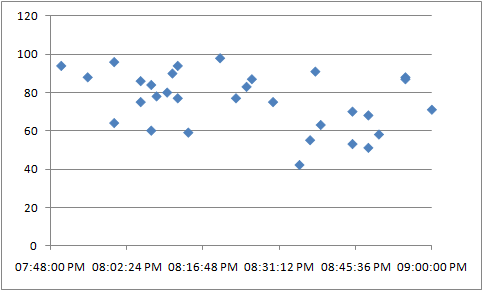
Statistics on the midterm:
- high score = 98
- low score = 42
- mean score = 75
- median score = 77
The answer key is pub:midterm-key.pdf
For each question, at least 1 person got full credit. (this means each question was possible).
Here is an interesting graph: time turned in vs. grade.
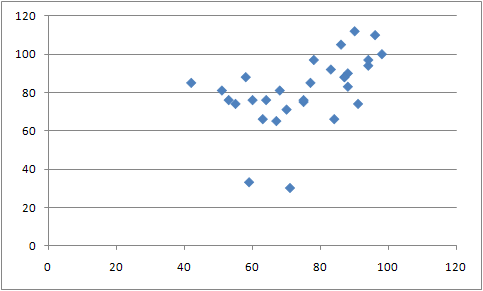
Here is the correlation between exam grade and P1 grade with outliers removed (note: P1 grades go over 100 - if we cap P1 grades at 100 (since you can’t get better than an A), the correlation is even better:
Grading scale (note: this is approximate, there are some fence cases that we might give the benefit of the doubt to)
- A = 90 or above
- AB = 83 or above
- B = 70 or above
- BC = 63 or above
- C = 50s
Page last modified on November 03, 2009, at 09:38 AM