
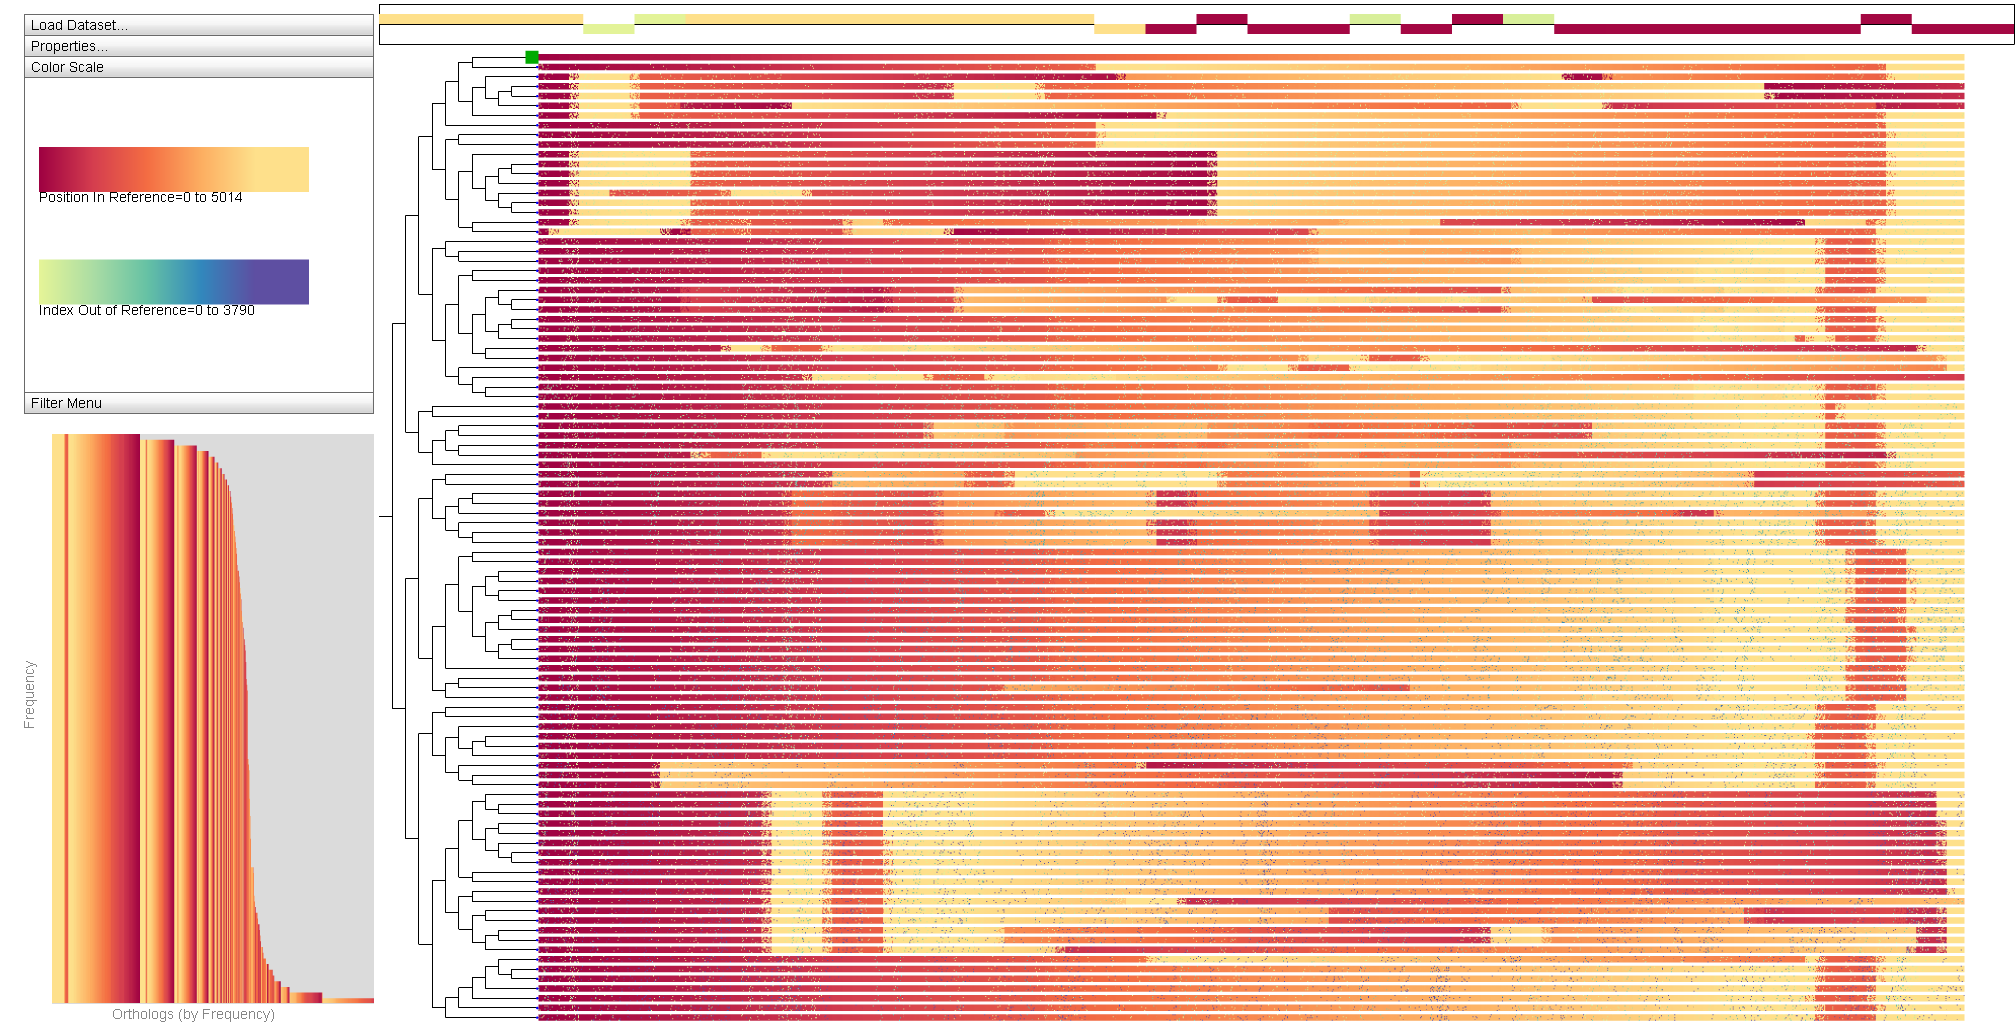
The Sequence Surveyor system was presented at InfoVis2011 in Providence. Sequence Surveyor provides overview visualizations for the exploration of large-scale multiple genome alignment datasets. The tool was developed to respond to the need for tools to accomodate the rapid growth in available sequence data. When viewing such large data, we necessarily cannot convey details, rather we specifically design overview tools to help elucidate large-scale patterns. Perceptual science, signal processing theory, and generality provide a framework for the design of such visualizations that can scale well beyond current approaches. Sequence Surveyor's design embodies these ideas for scalable multiple whole-genome alignment overview visualization. Sequence Surveyor visualizes sequences in parallel, displaying data using variable color, position, and aggregation encodings. The tool demonstrates how perceptual science can inform the design of visualization techniques that remain visually manageable at scale and how signal processing concepts can inform aggregation schemes that highlight global trends, outliers, and overall data distributions as the problem scales. These techniques allow us to visualize alignments with over 100 whole bacterial-sized genomes. The below sample dataset is a small-scale dataset from an evolutionary simulation of 100 genomes, each approximately 500 genes long. For instructions on using Sequence Surveyor, see the User's Guide.
Sequence Surveyor Software Package: SequenceSurveyor_0_2.air
Sequence Surveyor Sample Data: 100genome-500gene.sqlite, 100genome-500gene.tree
| Gamma-proteobacteria Sample Data (courtesy of UW Genome Evolution Laboratory): | 100Gammaproteobacteria.sqlite, |
|
50Gammaproteobacteria.sqlite |
Sequence Surveyor Instructions for use: User's Guide
Changes in Version 0.2:
- New default color settings.
- Fixed bugs with links.
- Display settings persist across dataset changes.
- Supplemental data from databases corrected.
- Zoom window details now correspond to only the selected zoomed block.
- Labels now appear in absence of a tree file.
Project Page | Sequence Surveyor | TextDNA
Adobe AIR must be installed to run Sequence Surveyor and TextDNA.
Email dalbers@cs.wisc.edu for more information.