Grading (Mid-Semester Feedback)

by Mike Gleicher on March 23, 2017

Update 3/25: My Python Script should have given you feedback as a comment in the gradebook for the assignment for the mid-term evaluation. The first version has some formatting problems making it hard to read, so I will  try to repost.

I promised people feedback in return for doing the mid-semester eval for me. Since a lot of you did the eval (thank you!) there’s a lot for me to do. The upside is this is good practice for final grades and to nail down some of the things that have been left undone.

Here is the information I have:

  1. Grades (on the silly 50 point scale) for the discussions
  2. Grades (on the silly 50 point scale) for the seek and finds
  3. Attendence estimates from Chih-Ching
  4. Quantitative stats (number of posts, length of the longest post) from all discussions (including the seek and finds)
  5. Some rough qualitative sampling of the quality of the discussions (I read through at least 1 assignment and 1 seek and find for everyone)

I have no information on the Design Challenge (it hasn’t been graded yet)

The measures we have are rough:

  1. The grading of discussions gives most people 50 on most assignments. This doesn’t distinguish the “great” (A) from the “good” (AB). There is some noise (some 50s should be 40s, or vice versa, sometimes late grades don’t reflect otherwise good work, …). But overall, if you apply a robust statistic to it (e.g., drop the lowest scores) it says that a person’s performance.
    Most students are in the “usually get 50” category – which will be an AB or A, as determined by closer examination. Others are “usually 40 or 50” or “usually 50 except when sick” – the former is likely to be a B or AB depending on #2 below.
  2. The quantitative measures are not necessarily measures of quality – but they do seem to be well correlated with the actual subjective reading (until someone tries to game the system by padding their posts – don’t try it). This will be how we distinguish “good” from “great” for the discussions (with some manual checking for validation). We’ll adjust within the grade bands (see #1) based on this information.
  3. Checking for attendance is a proxy measure for actually participating in class. However, it seems that most people who come to class do participate in the in-class exercises, and I’ll assume that you’re listening enough to the monologues. There’s also some noise in seeing whose there (we don’t check every day, and Chih-Ching may not be perfect at knowing everybody). Most people are there “almost always” – so we’ll assume that’s not a problem. For a few people attendance is a problem – in most cases, we’ve discussed the situation. But if you’re a significant non-participator, expect a penalty
  4. Grading the Design Challenges is tough too. It’s pretty subjective. I expect people will generally do well.

How we’ll grade in the end… DON’T TRUST THE NUMBERS CANVAS TELLS YOU WHEN IT AVERAGES!

  1. The 3 design Challenges will be graded on an A-F scale and averaged. They will count for 1/3 of your grade.
  2. The 15 weekly assignments and 1 Design School Assignments + the peer critique assignments: we’ll robustly average (drop the lowest N ~= 2-3) your “grades” to determine a grade range. We’ll use the quantitative metrics (robust average of [# posts, length]) with a qualitative check to adjust (usually, this will put people to the top of the range). They will count for Y% of your grade.
  3. The 15 seek and finds: we’ll robustly average (drop the lowest N ~= 2-3) your “grades” to determine a grade range. We’ll use the quantitative metrics (robust average of [# posts, length]) with a qualitative check to adjust. This will count for 1/4 of your grade.
  4. If your participation is problematic we will penalize your final grade.

What you’ll get in your “feedback” (which I will try to post into the Canvas comments for the mid-term eval “assignment”):

  1. numerical scores (robust averages of canvas assignments)
  2. quantitative metrics (robust averages of max post length, robust average of number of posts – which are “normalized” by subtracting the median # of posts on that assignment for the class)
  3. our estimate of how many of the 10 time chih-ching checked attendance you were there (we did not count the 1st weeks when there were enrollment problems)
  4. brief comments interpretting 1-3

Seek and Find 11: How did they make that?

by Mike Gleicher on March 21, 2017

Due: Friday, April 7

Handin: As a Canvas discussion post (link)

This seek and find is a little more open ended than usual… pick a visualization on the web that makes you think “how did they do that?” and try to see if you can figure out what the underlying technologies are.

In general, we’ve been trying to think about visualizations without considering the implementation. But now, let’s consider the implementation.

When you look at an impressive visualization, can you figure out how the authors made it? Can you at least think about what tools would be appropriate (or not)?

You can cheat by picking a visualization from a tutorial or visualization web page (like an example from the D3 gallery) – in which case, the author will tell you what tools are being used. But, the spirit of this assignment is to look for visualizations “in the wild” and see that it isn’t always so easy to figure out the implementation details.

Reading 11 and Assignment 11: D3

by Mike Gleicher on March 21, 2017

Due: Initial Reading and Posting, Monday April 3, Additional Postings by April 7, discussions close April 14.

Hand-in: Canvas (link)

D3 is a toolkit that is used to make visualizations for the web. It’s not an easy thing to learn since it requires you to be familiar with a lot of web programming stuff and idioms before you even start.

3/25 update: because the coming weeks will have design challenges (Design Challenge 2)  going on, I realize I should adjust the expectations for readings and discussions a bit. Also, based on feedback, I will stop splitting readings and discussion assignment postings. 

New requirements:

It’s not something that we can really teach you to use in this class – but I want to teach you about it. What each person will take away from this is different, but hopefully, everyone will learn something – even if it’s just to appreciate the people who have gotten good with D3.

Let me list off some readings, and then explain the assignment

  1. To start, read my 2015 rant about why you may or may not want to learn D3. It’s a little out of date (we use Javascript in some other classes now, so I have more experience helping students learn it).
  2. The D3 paper is an important starting point. It’s the “academic document” that tries to explain why D3 is what it is, and why it’s a good idea. It’s a weird mix of an academic CS paper, with lots of specific implementation details (which are less common in academic CS papers). The paper really is the best way to get the rationale and the key ideas, you just have to skip over a lot of acronyms and buzz-words.
  3. On the D3 web page, there is a huge list of tutorials. I don’t know which ones are good or not.
  4. The O’Reilly Book “Interactive Data Visualization for the Web” by Scott Murray is available on line for free. http://chimera.labs.oreilly.com/books/1230000000345/index.html This is more of a “here’s how to use D3” book (which might be what you want), but its decent for that. I don’t know if its better or worse than other tutorials. It has an overview of the underlying technologies that you need to know. But Chapter 2 can give you a sense of what D3 is roughly about. Chapter 3 gives a brief tour of the web technologies – it tries to cram an entire class on Javascript programming into a subsection.
  5. If you want to understand what D3 can do, there is a huge gallery of examples. Although, the most interesting examples are where it gets used in practice – many of the visualizations you seen in the web browser (that are of the form that D3 can do well) are done with D3. The examples on the gallery page are nice because they show the source code.

How do I make this work for everyone? I don’t know. Lot’s of people’s eyes will glaze over when we get to any detail. Some of you will want to dive in and tinker, and others would need a lot of background before doing anything.

So, what I’d like you to do…

  1. For Monday’s posting: read #1 (the rant) and chapter 2 of #4, then start to try to read the D3 paper. Depending on your background, you might not get too far before you’re totally lost. But: you can ask questions (since someone in your discussion group is likely to have more background)
  2. In the posting due Monday 4/3: Describe what you think D3 is for – why do the people who like it like it? Where does it get used? Why? What are the concepts in it that make it so great? Also, ask questions where you got stuck. Probably somewhere in the D3 paper, you will have gotten lost, or there will be some concept (or list of concepts/terms) that you don’t know. Ask. Hopefully, someone will answer. If not, I’ll get a sense of where people get stuck with this.
  3. Over the course of the week… play with some of the demos #5. Post links to interesting ones you find. Try to find ones where the code is given and/or explained. Get a sense of what people do with D3 (answer: a lot).
  4. In class on Wednesday, April 5, we’ll play with some D3 demos and experiment with changing them to see what’s inside them. Bring your laptop so you can play along. Even if you can’t program using D3, you might learn enough to be able to read an example and change it to suit your needs.
  5. Look at some of the tutorials (maybe not as much if you’re not a programmer) – see if any look particularly good. (you might also look through some of the book #4)
  6. For your postings/discussion: discuss your experience learning about D3. Maybe the questions where you got stuck will be answered. Maybe you’ll get some ideas about the underylying technologies even if you can’t write D3 programs yourself. Maybe you’ll see some cool thing someone did with D3. Maybe you’ll be inspired to learn to program in Javascript this summer. Write 3-4 more postings, hopefully in conversation with others.
  7. If you have more of a CS background, you might actually be able to try to use D3. Are there tutorials that seem particularly useful? What did you try to do?

There’s a required posting and 3-4 (minimum) additional postings to put on the Canvas discussion (link coming soon).  additional discussion is recommended – we aren’t going to force you to discuss, but discussion is a good way to learn and help others learn (and possibly improve your grade).

Even if you never write anything using D3 yourself, you will most certainly use things created with it, and probably be around others who are using it. So, having some appreciation for it is useful.


The Week in Vis: Spring Break Edition (3/27-3/31)

by Mike Gleicher on March 17, 2017

It is Spring Break – so this is for the week coming up after break!

This past week, we talked about interaction and we did an in-class design assignment. The first Design Challenge was due.

The last part of the Design Challenge, peer critiques, has been assigned. You should have received email from Alper. Because we were late in getting these out to you, we are giving you extra time (They are now due on March 31st).

After break, we’ll be talking about graphs. You can get started on Reading 10 and the Associated Discussion 10.

After break, we’ll be doing Design Challenge 2. You can start early if you like.

The Schedule:

  • Monday March 27 – Lecture on Graphs. Reading 10 (first part) is due, as is the first posting for Assignment/Discussion 10.
  • Wednesday, March 29 – In Class Exercises. We’ll do some experimenting with graph drawing, and some critiques.
  • Friday, March 31 – No Class! As usual, the Seek and Find for the week and the other posts for Discussion 10 are due. Unlike usual, your Peer Reviews for Design Challenge 1 are due. (we gave people extra time).

Design Challenge 2: Design by Hand

by Mike Gleicher on March 17, 2017

4/16/2017 – Additional Explanation of Phase 3
3/17/2017 – First version posted, missing links for handins

The first Design Challenge gave you real data and encouraged you to make design with real tools – but many people skipped the sketching phase. This design challenge emphasizes the sketching / drawing by hand parts. We’ll have 2 separate problems that you’ll work on over the next 3 weeks. (The third challenge will have real data again, and let you do some implementation if you are so inclined)

This Design Challenge has two main parts. One was a Design Challenge in 2015 (although we have modified it a little). The other was an in-class exercise in 2015 that took too long for an ICE, so we’ll do part of it as part of the design challenge.

Schedule

Challenge begins: (officially) March 27 – although you can start as soon as you read this. All you need to do Phase 1 is in this posting.

Phase 1: Initial Designs and Analysis of Airline Route Maps (due Tuesday, April 4) – since we’ll tell you things on Wednesday April 6 that will influence what you do.

Phase 2: Final Designs and Analysis for Airline Route Maps (due Tuesday, April 11)

Phase 3: Initial Designs for Problem 2 (“The Paris Apartment Problem”) (due Tuesday, April 18 – but DC3 will start on April 17)

Phase 4: In-Class Critiques and Design Iteration on Problem 2 (date TBD, probably April 26)

Note that Phases 1 and 2 are independent from Phases 3 and 4.

Phases 1 and 2: Airline Routes

The goal of this assignment is to give you some practice at applying the basic ideas we’ve learned about visualization and graphic design. The idea is to pick a simple “data visualization” problem that you’ve probably seen, try to understand the task, think about the standard designs with respect to these tasks, try to invent some new designs to address tasks, practice critiquing designs, and to think about evaluation.

The specific problem chosen (Airline Route Maps) is hopefully simple enough in terms of its domain, that everyone is enough of an “expert user.” You might see it as a cartography problem (since the standard solutions are maps), but it can be seen more broadly. The data itself is a network (in terms of abstract data type), and we won’t talk about network approaches until later in the class. You can read ahead (Chapter 9 of Munzner’s book is a good start), but you can also try to build off the basic principles you already know.

For this challenge, we won’t actually provide the real data. We just want you to think about the problem in the abstract, and make the designs as “data sketches” (with made up simple data). So, when you create a design, you can make up a fictitious airline – but give it the kinds of properties that show off the challenges and solutions.

Also, for this challenge we want you to create your designs by hand. We encourage you to do everything on paper (with pens, markers, colored pencils, …). If you want to draw on a computer, that’s OK, but you will need to print things out. Conversely, at one step, you will need to get your paper design into the computer – but we’ll help with that.

The Traditional Design

You’ve probably seen an airline route map in the back of the magazine on an airplane. Usually it’s a map, with points for cities, and arcs (or curved edges) connecting city pairs with flights.

Here are the pages from the Delta in-flight magazine (click for scanned PDF):

delta

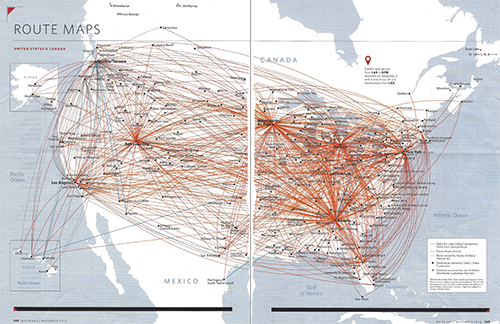
Here is one for United that I found online (click to Zoom):
United_Airlines

There’s a website http://www.airlineroutemaps.com where you can see lots of these. If you dig, you can probably find some non-traditional designs (but don’t look too hard for them – the idea is for you to come up with alternative designs yourself). Here’s one for United, Allegiant (a smaller US Carrier)…

They’re not all this bad… But when an airline has lots of flights to lots of cities, showing this information gets tricky!

What’s the Data? What’s the Task?

Hopefully, those are the first two questions that you are asking.

Part of this assignment is for you to figure this out. So, before you read further (spoiler alert), think about those questions. For task, you can probably think of lots of things you might want to do with “this data.” So we need to define this data.

Have you thought about what the data is yet?

For this assignment, we limit ourselves to the route connection data. That is, all we know is a list of the city pairs the airline flies between. Just a yes or no – does the airline fly between those two cities. We can have some extra info (like where the cities are on the map) if we need it for making pictures.

As far as tasks – think about what you might want to do with information about what routes an airline flies.

The Design Challenge

Here are the things we need to do:

For the first phase, we need to consider what the tasks are for this data, and use that to come up with some initial designs. You’ll create a list of possible tasks for a “map” made with this data, critique the standard design, and come up with 1-2 new designs of your own.

For the second phase, you need to come up with 2-3 different designs (that are not the standard design).

All of your designs (minimum 3 total) need to be “different” from the standard design, from each other, and from the ones discussed in class (unless you come up with the one from class before we reveal it. There’s a question as to what constitute “different” (from the standard design, or from each other). Hopefully, you can come up with something that is “obviously” very different. A baseline rule of thumb: if the brief description of one would apply to the other, then maybe they aren’t different. Of course, you can explain why a design is different (from the standard, or from your other designs).

You need to come up with at least 3 different designs (1 for part 1, 2 for part 2). You may turn in up to 5. If you turn in more than 3, we will only pick the best 3 to look at. That said, designers often like to work by trying lots of designs, so you might want to make lots of different ideas, and just write-up/hand-in the 3 you think are best.

To help you in thinking about creative solutions for phase 2, we’ll show you (at least one) clever design for a specific task (probably in class, but maybe via the web) on April 5th (after you do part 1).

For each design, hand in a separate PDF file (1 PDF per design) that has: (and note – you need to turn in more than just the designs)

  • A rationale for the design (this should explain what tasks you are trying to address). You may acknowledge tasks that you cannot do with your design
  • A description of the design
  • A picture (or pictures) – these are probably sketches, based on “fake data.” But try to convey the essence. You might not be able to draw all arcs, or …
  • Do not put your name in your PDFs. We might do peer review.

Some thoughts on design:

  • Part of the challenge is that these maps are printed, so they are static images. At least 2 of the designs you turn in need to work in this form (e.g. they can go in the in-flight magazine). So, if you want to have a dynamic or interactive design, you can throw one in.
  • We haven’t specified what airline, so you don’t have data. Imagine a fictitious airline with a network similar to one of the major US carriers (look at the United and Delta examples). It would have a few hub cities scattered around the country. It would fly to most major (and most minor) cities from at least one of these hubs. If you want to make assumptions about the airlines routes, or have specific ideas in mind, feel free to describe it in the design descriptions.
  • We recommend making sketches of your design. Print out a blank map (link here, bl.ock here) – or start with a blank page. (hint: not all designs have to be geographic maps). You can sketch on a computer if you prefer (using a drawing tool). But what we want is the picture. Remember, the goal is to create a “sketch” that conveys the essence of your design, not to make a beautiful example of it. It needs to be good enough that (combined with the description), someone can understand it and critique it.
  • Hopefully, you’ll recognize this as a graph visualization problem and use some of the ideas from graph visualization.
  • It’s OK to make visualizations that are task specific. Just be sure to describe the task.

What to turn in for Phase 1 and 2:

For Phase 1: (turn in on Canvas (link), Tuesday, April 4 – since on Wednesday April 5 we’ll give you some hints for Phase 2).

  • Turn in a list of tasks you can think of that you can think of wanting to do with one of these maps. This is connected to your “critique” of the standard design (e.g. the United and Delta maps shown above).
    You need to identify some tasks the standard design is good for, and some tasks the standard design is not good for. You might present this as two lists, or you might put a comment with each element of the task.
  • A brief critique of the standard design – what are it’s good and bad points. Some of this is in the task lists above.
  • At least 1 design. It must have the 4 parts described above. It should address some of the tasks in your list.

For Phase 2:(turn in on Canvas (link), Tuesday, April 11)

  • You need to turn in at least 2 designs. For a total of up to 5 (including what you turned in for Phase 1).
  • If you want to update your task list from Phase 1, you can. Turn it in as part of Phase 2.

Note: Do not turn in designs for Phase 1 late. If you don’t turn in a design for Phase 1, turn in an extra one for Phase 2.

Evaluation: We will provide a rubric for how we will evaluate your designs. In 2015, we provided a rubric for students to do peer evaluation – we may follow a similar structure for our  assessment. We may (or may not) do peer evaluations.

Phase 3 and 4: The Paris Apartment Problem

For phase 3 and 4 of the Design Challenge, we’ll look at a different design problem, and we’ll approach it a little bit differently. We’ll ask you to think about the problem and turn in some initial designs, but we’ll do the final designs as an in-class exercise.

In this problem, the data is information about restaurants in a city. (imagine Paris) They all have a location on the map, and they all have a set of attributes (cuisine, price range, star rating, open late, …)

The reason that this is called the “Paris Apartment Problem” is that the first task we considered in class in 2015 was the problem of picking an apartment that had good proximity to good food. We also considered a different problem of making glyphs (symbols) that encoded information about restaurants so we can put dots on a map. Both of these were in-class exercises. In both cases, students wanted more time than they had in class. So this year, we’re going to make it a hybrid (start at home) assignment, and put the two parts together.

There Paris Apartment Slides that I made for that last class that give some aspects of the problem. A little more explanation below.

For this year’s design challenge I want you to consider both challenges seperately:

  1. Design glyphs (small symbols that could be placed on a map) that encode various attributes of the restaurants in the symbol. You need to design (at least) 3 different glyph designs – and you get to choose the task for each.
  2. Come up with a design (at least one) that is not just symbols on the map that addresses the specific “compare the apartments” problem.

For this phase of the assignment, you need to turn in at least 4 designs (3 glyph designs, each with a task, and one non-map-based design for the apartment task). You can turn in up to 5 glyph designs and up to 3 non-map designs.

Glyph designs should describe the task the design is meant to serve. It should describe the encodings. It should have a sketch of some examples.

Non-map designs should have a sketch (or sketches), and a description (especially if the sketch requires interpretation).

We’ll provide some simple examples of each (coming soon).

For phase 3, you will turn these designs in (each design as a separate PDF) via a Canvas link.  Phase 3 is due on Tuesday, April 18th (in keeping with our “DC due on Tuesday” tradition).

For phase 4, you will bring your designs to class on paper. Each table will critique the different designs that people bring, and use those to make a “best” design to show to the whole class.

Additional Explanation for Phase 3: (added 4/16):

The problem is to compare two apartments – considering their proximity to restaurants.

if you prefer…

Compare the restaurants around two different locations.

Here’s a non-visual, non-map, simple “textual visualization” that doesn’t provide all the information that a good assignment could. (fake data of course)

Apartment A:
3 block radius: 3 bakeries, 4 restaurants (2 expensive, 2 cheap)
6 block radius: 7 bakeries, 9 restaurants (4 expensive, 5 cheap)
Apartment B:
3 block radius: 2 bakeries, 3 restaurants (1 expensive, 2 cheap)
6 block radius: 5 bakeries, 8 restaurants (2 expensive, 7 cheap)

The obvious design is a map with glyphs for restaurants (which is why you have to design glyphs for part 3.1). But the textual version might give you a sense that there are alternatives that more directly address the tasks (part 3.2 and 4).

The course schedule page has been updated

by Mike Gleicher on March 16, 2017

Several people still weren’t aware of the Course Schedule Page. Even though there is a button for it at the top of screen (in the menu) and it is bright green so it’s more obvious. I just updated it for the planned schedule for the first 3 weeks after break. If you want to get a start on things, the readings/assignments for after break have been posted (although the Canvas links might take a few days).

Seek and Find 10: Graphs

by Mike Gleicher on March 16, 2017

Due Date: March 31st (discussion stays open until April 7th)

Turnin: on Canvas (link)

For this seek and find, you need to find an example of a graph visualization. It doesn’t have to be a node-link diagram (but it can be). It cannot come from a paper about graph visualization.

Critique it – describe tasks that it might be for, and consider how well it addresses them How does it address the issues in graph visualization?

Assignment 10: Graphs

by Mike Gleicher on March 16, 2017

Due Date: Initial Posting Due Monday 3/27, Required Postings Due Friday 3/31, Discussion closes 4/7.

Handin: this will be a discussion on Canvas (link)

Reading: see Reading 10 (Part 1 due 3/27)

3/25 update: because the coming weeks will have design challenges (in fact for this week both the end of Design Challenge 1 and the beginning of Design Challenge 2) are going on, I realize I should adjust the expectations for readings and discussions a bit. Also, based on feedback, I will stop splitting readings and discussion assignment postings after this. 

New requirements: required questions can be answered from class / the first part of the reading in light of the reduced second part. Discussion is recommended (we are counting!), but forcing people to discuss seems to be disliked. If you have something to say, please say it. We do consider discussion in grading, but you can decide how much discussing to do.

Graphs are a big topic that we won’t spend enough time on. But hopefully, from the readings, lecture, and assignments you’ll get some appreciation for why they are a big deal.

For this discussion, you are required to make 3 “initial” postings, and (at least) 2 postings in response to others (so a minimum of 5 postings to the discussion). (optionally, but recommended – especially if you want to really learn the material) have some discussion. This is a good opportunity for the more CS-oriented students to explain to the less CS-oriented students some of the technical stuff in those algorithms papers.

The required questions:

  1. (respond to this first, by Monday 3/27) Why is visualizing graphs/networks different from “normal” data, and what are the specific challenges that come up?
  2. When you look at the treevis.net website, you can see a lot of different ways to represent a tree (which is a special kind of graph). Pick one that you found surprising/weird (at least from the picture, you don’t need to read the paper). What do you think is good/bad about it? Why did you think the author made it?
  3. (this is best done after the class exercise on Wednesday, and connects to part 2 of the reading) What might you consider in laying out a node-link diagram? What kinds of challenges come up? What does it mean to do it well?

Reading 10: Graphs

by Mike Gleicher on March 16, 2017

Due Date: Part 1: Monday, March 27th (preferably before class); Part 1b, 2 Friday, March 31st (assignment)

3/25 update: because the coming weeks will have design challenges (in fact for this week both the end of Design Challenge 1 and the beginning of Design Challenge 2) are going on, I realize I should adjust the expectations for readings and discussions a bit. Also, based on feedback, I will stop splitting readings and discussion assignment postings after this. 

New requirements: Do readings part 1 (Munzner Ch 9 and TreeVis.net). Then pick any 2 of the other “readings.” (and you can just look at Munzner’s slides, or skim one of the long surveys). You are of course welcome to read more – especially if you’re a computing-oriented student and interested in the cool algorithmic challenges of graph layout.

So far, we’ve been talking about encoding information about individual objects. Now we’ll talk about encoding information about the relationships between them.

The word “graph” here is graph in the mathematical sense: data that described the connection between “nodes.”

One thing that is different about this reading: there are some more technical CS topics. So the reading suggestions are more complicated.

Part 1: Monday, preferably before class. Everyone should do these:

  • Chapter 9 of Munzner (link).
  • Look at treevis.net which redirects to here. There are about a zillion different visualizations of trees. Mainly look at the pictures and appreciate the diversity.

Part 1a: this would have been for Monday – but with break beforehand, I wanted to keep Part 1 light – so do it later in the week if you want. This is now optional (see above)

  • Tamara Munzner. 15 Views of a Node-Link Graph: An InfoVis Portfolio google06:Google TechTalks, Mountain View CA, 6/06 Talk video (Video on YouTube) (slides)
    I think it gets the point across that there are lots of design choices and options. Plus, you’ll get a sense of the person behind the book (although, this was almost a decade ago). But, sitting through the hour is a bit much – so it’s OK to just watch a little bit and read through the slides.

Part 2: (for later in the week) The idea was to focus on graph layout. This is a place where we could get some depth into graphs. Except that not everyone has enough background for the deep dive into graph layout algorithms (and it is a really deep topic, with a lot of theory and algorithms, a lot of practical stuff, and even some HCI/perception stuff). And there are many different aspects to this – far more than for a single reading. And, there are other things going on with the Design Challenges, so I’ll require less than last time.

If you’re computationally minded, you should look at the following two things (you can look at things in the other list as well)

  • Scalable, Versatile and Simple Constrained Graph Layout. Tim Dwyer. EuroVis 2009. (pdf)
    It’s a modern take on graph layout. the method gives a sense of the evolution and all the methods that came before it). This might be a little too CS-technical for most people. Don’t worry about the details of the algorithms, but get a sense of the kinds of things the best algorithms try to achieve.
    In practice, people usually use simpler algorithms (force-directed layout)
  • von Landesberger, T., Kuijper, A., Schreck, T., Kohlhammer, J., van Wijk, J. J., Fekete, J.-D., & Fellner, D. W. (2011). Visual Analysis of Large Graphs: State-of-the-Art and Future Research Challenges. Computer Graphics Forum, 30(6). doi:10.1111/j.1467-8659.2011.01898.x (official version) (authors’s copy) – This is a rather intimidating survey. Read it to get a sense of what the basic methods are – don’t try to get at all the details and subproblems and … (the Herman et. al. survey below is a less intimidating variant)

These papers are a little less CS technical, and say much less about the “how” and you should read them if you aren’t as focused on the CS technical issues.

  • Ware, Colin, Helen Purchase, Linda Colpoys, and Matthew McGill. “Cognitive Measurements of Graph Aesthetics.” Information Visualization 1, no. 2 (June 1, 2002): 103–10. doi:10.1057/palgrave.ivs.9500013. (official) (author’s version)
    An older paper that provides some initial experiments into what matters when drawing a graph. It’s the first in a long sequence of papers on graph readability, and is a good place to start.
  • Herman, I., Melancon, G., & Marshall, M. S. (2000). Graph visualization and navigation in information visualization: A survey. IEEE Transactions on Visualization and Computer Graphics, 6(1), 24-43. doi:10.1109/2945.841119 (official IEE Version – free on campus, or use the library’s EZProxy service)
    This is an old survey, but it gets at the core issues really well. It’s a little less intimidating than von Landesberger, but not as current. Look through it to get a sense of the various issues that people consider, don’t worry about the details.

That’s already probably too much reading for the week, and we haven’t even touched on edge bundling, or gotten into any of the practical layout algorithms, or … (so we have adjusted the expectations – see above).


Visualization Resources

by Alper Sarikaya on March 15, 2017

We’re going to curate a list of (potentially) useful resources for data visualization here.  If you have any suggestions, let us know!

Other Data Visualization Courses

A selection of other data vis courses.  Note that nearly all of the offered classes are also in Computer Science, and therefore may be more implementation/programming-specific instead of design-focused.

Data Visualization Toolkits

These are all useful tools to know and have in your toolbox.  Knowing what sort of visualizations these are useful for can help narrow down the toolkits relevant for your particular task or project.  You might be interested in a high-level overview comparing these tools—Lisa Charlotte Rost has two blog posts that help provide this context: one for visualization tools, one for visualization libraries.

  • D3.js — A web-based framework for displaying data using SVG in the browser; can be extended to displaying spatial (e.g. cartographical) information as well.  A little bit of a learning curve, but widely used in interactive data journalism.
  • Processing and Processing.js — A design-oriented programming language; makes it very easy to create an interactive data visualization.  The javascript version allows for web-based vis.
  • Google Maps API — The original mashup tool, useful for placing data in their geographical contexts.
  • Mapbox’s Leaflet.js and Mapbox Studio — Very flexible tools for displaying data on an interactive map, definitely useful to learn if interested in cartography (and even better with WebGL-enabled vector maps using Mapbox GL JS!).
  • PolyMaps — Quickly get up and running with SVG-based maps
  • WebGL (and OpenGL) — Support for three-dimensional visualizations and large data visualization using the GPU.  High learning curve, but very powerful.
  • VTK — Scientific data visualization toolkit (C++), especially useful for tensor and volumetric methods, mesh operations, and three-dimensional interaction.
  • The InfoVis Toolkit (IVTK) — Java-based toolkit for quickly creating abstract data visualizations.

Data Analysis/Gathering Toolkits

These are tools to help you gather data (e.g. scrapers) and the analysis and transformation of data.

Gathering

  • Import.io — A tool to help gather data from arbitrary websites.  Clunky, but once you get it working, can even gather up-to-date data.
  • Web scraping — Some ideas for harvesting data.
  • Tableau Public — Connect to spreadsheets and extract data for tabular and geographical viewing.
  • Microsoft Excel — Useful interface for gathering data from manual input and quickly visualizing trends using threshold rules or sparklines.

Analysis and Transformation

  • Tableau for Students — The full version of Tableau provides facilities for defining abstractions, hierarchies in data, and suggests types of visualizations for particular visual tasks.
  • UpSet — A recently-released academic tool to allow analysts to find relationships in their data.
  • Matlab and R (and GGplot2) — Statistical analysis tools for transforming data.  Both are very powerful and thereby have a little learning curve.
  • NumPy/SciPy — Python-built numerical analysis and transformation libraries.
  • SQLite3 or your favorite type of database — Useful for on-demand visualizations to query data or generate metrics.

Color Resources

Some ideas for building color-ramps and selecting color palettes:

  • Adobe Color CC — Originally called Kuler, provides a way for creating ‘harmonious’ colors based on various metrics; also can browse other user-selected palettes.
  • Cynthia Brewer’s Colorbrewer2 — Perceptually-aware color mappings, great for mapping continuous and categorical data to binned colors. Check out colorbrewer.js for easier inclusion in web-based visualizations.
  • Conor Gramazio’s Colorgorical — Randomly generate distinct colors for labeling categories by category; can add color constraints (like use this color, don’t use this range of color)
  • Color by HailPixel — A fun way to build a color palette by moving the mouse around.