
Visualizing English Print
Textual analysis of the printed record
About

- Introduction
- A Recap of the Accomplishments of the Pilot Project
- A Review of the State of the Art and VEP’s Distinctive Contribution
- Research Overview
- Distribution of Software and Methods
- Sustainability Beyond the Grant Period
- Intellectual Property
- Support
- Table of Current and Projected Software Development and Dependencies
- Work Plan
- Deliverables
- Glossary
Introduction
By considering large corpora in literary analysis we will be able to do things such as the following: gaining a more balanced view of print culture by considering texts beyond those commonly read; being able to see patterns of subtlety at multiple scales; tracing the development of types and word usages; and sensing the connection between historical development and the printed record. Large corpora will permit us to provide more precise and convincing answers to existing questions, as well as to consider a more diverse range of topics. This includes, for example, creating a supplement to the historical scholars’ bible, the OED.
Doing textual analysis at a large scale brings up a challenging tension: On one hand, the desire to consider large scale requires us to think computationally. The amount of data and the potential for subtlety is simply too large for manual study: we need to bring computational thinking to literary scholarship. We need to embrace automation, thinking of text as data, abstraction, formalization, and statistical inference. On the other, we cannot give up the traditional elements that make textual analysis successful. We need to preserve humanist thinking. To value the importance of exemplars and outliers, to ground arguments in specific small-scale details (such as close reading), and to view evidence in light of diverse expert background knowledge not only in literature, but in history, philosophy, politics, and other humanities and social sciences.
The VEP project brings these two ways of thinking together. We need to find ways of combining humanist and computational thinking, develop new techniques that support these ways of thinking, embody these techniques in systems that support scholarly workflow, and use these systems to demonstrate the value of this way of thinking to textual analysis.
The new way of thinking embodied in this project combines humanist and computational approaches. First it is necessarily multi-scale, requiring connection between corpora scale analysis (gross) and close reading (fine), and many intermediate scales in between. Second, it requires combining the background expertise of a humanities scholar with statistical analysis, which typically seeks to be unbiased and not utilize such implicit information.
The VEP project brings together computer scientists and literary scholars as partners. We will break new ground in computational science, developing new techniques that better support humanist thinking. We will innovate in the literary sphere, showing how the introduction of computational thinking and the new tools we develop for applying it can be used to lead to new understandings of literature, language, and their development.
The key to this project is the symbiosis that occurs by cross-pollinating these two ways of thinking. In our pilot project, we made advances in each front. One of the most significant outcomes was to learn the value of the exchange of ways of thinking. In the continuation of the project, we will advance this new way of thinking, develop new tools that support it, provide demonstrations of its value to literary scholarship, and disseminate it to the community.
During our investigative year, we found that our research, and the research we wish to enable others to undertake, can be summed up in two activities: comparison and explanation. The former guides our questions about print culture: How do we know when two or more items are similar? The latter guides us in tool and method development: How can we articulate, mathematize, and visualize metrics for textual similarity at many orders of magnitude? These questions constitute the core of humanist disciplines as they touch computer science and mathematics.
To take literary criticism as one example: Is there a way to measure a document’s literariness – the perhaps ineffable but also paradoxically quantifiable qualities of the poetry, plays, novels, and non-fiction prose that comprise the Western canon – by their proximity to other literary documents on different scales of measurement? When we use the term literariness, we are first referring to the documents that have attained the ratification of generations of readers as great literature. (The “ineffability” of the literary refers to the difficulty literary scholars and other readers have had in defining precisely what makes the literary except by putting forward and analyzing individual examples.) These are the books most commonly taught on literary syllabi and which make it into collections and summaries like “Masterplots,” meant to capture the best of world literature. Historically the reasons that texts fall into the category of the literary are myriad, and the literary justifications of judgments also range widely. However, our early analyses have shown that there are rhetorical, linguistic, and other statistical patterns (such as frequency of word usage) that these texts have in common, patterns that do necessarily initially register to the human eye. We are moving towards a method of choosing texts as exempla: works that have the ratification of scholars as belonging to a certain class, such as the literary, and searching for what they have in common with one another and how they differ (or do not) from other printed materials. Pre-identified literary texts can exhibit a preponderance of common structures that are different from those of other texts in a dataset generated from all available early modern printed materials. The method of using exemplary materials to find similar materials is one common in computer science, and it is one that can bear significant fruit in other domains. Indeed, the well-known literary arbiter Matthew Arnold suggested as much in his nineteenth-century essay “The Study of Poetry” when he proposed using the great works of literary history (not limited to poems) as touchstones for finding and evaluating other work, but he had no systematic way of experimenting with his theory in practice.
A mechanical or numerical definition of the literary can raise hackles, and necessarily so, because definitions of humanness are so closely tied to creativity, literary and otherwise. However, we mean not to replace humans but rather to put forward sets of texts with common attributes that register as similar on different scales of measurement for the purpose of showing their features to human experts to analyze. We succeed computationally when we have located patterns that readers, professional and not, have not found on their own but are eager to interpret. Tests that can identify algorithmically what we already know (such as what is literary) and then add information about the qualities that comprise these texts (often previously unknown) is one step in our process. The next is to use the same metrics to find both the hitherto unidentified nearest neighbors of these texts and the texts that have no metrical proximity to our exempla in order to offer up multiple hypotheses on how the matrix of print culture is put together for humanist experts to analyze. What distinguishes a text that has literary aspirations but that falls short when critics analyze it? What documents that are not poetry, drama, or novels share rhetorical qualities with those that have garnered the most historical attention? This method of using exempla and finding neighbors and non-neighbors is not limited to the literary: it works for any exemplum or class of exempla. It is particularly good at identifying genres and subgenres across printed material. By first answering the question in ways that speak to the history of a single field, we establish the groundwork for moving into other sources, genres, and disciplines that study print culture. In successive years, VEP will build an integrated tool, run experiments, and engage interlocutors in this research across fields.
Underlying this project is the assumption that there are patterns often undetected by readers, patterns that can better be seen as the number of literary objects increases, whether we count or label genres, books, plays, chapters, sentences or words. Using techniques from computer visualization, researchers can tune into these patterns, bringing into focus the particular characteristics of the literary production of a decade or a genre or a subject.
Our current software tools have verified our hypotheses that works by single authors are most similar to one another, followed by similarities among works during a single time period (the decade is our standard temporal span), succeeded by works in a single genre. Sifting through the interplay of these complex factors is a task for which we need better tools: at the moment, our software allows us to see one of these factors well at a time, but it requires considerable experience using statistical tools to get this far. We aim for a more intuitive approach to making these distinctions using our graphical interface on top of our core engine.
Such skills allow us to see, for example, how strongly each act of Renaissance drama contributes to whether a play is a tragedy or a comedy or another subgenre. Act V by definition identifies the subgenre of a play – an ending in marriages or deaths or compromises, but – perhaps surprisingly – the same analytic tool that can label comedies, tragedies, histories, and romances can do almost as well examining only Act IV, suggesting that the build-up to the finale is as significant as the end itself. Then scholars can see from tagging techniques what the clues are that evince the genre in ways not specified by the usual definitions but clearly evident in the practice of playwriting. This technique for analysis needs to be extended to other genres with more texts on a larger scale.
The next phase of our work focuses intensely on how we move back and forth between information-rich visualizations supported by a powerful analytic engine to multiple individual texts so that the pictures or statistics can be verified by textual information. Computer techniques have the power to generate hypotheses that can then be tested by a combination of statistical analysis and techniques of close reading.
We note here that this proposal reviews important discoveries of the pilot year, generously funded by the Andrew W. Mellon Foundation, as they are relevant to future work, but this document’s focus is on what will be created after the NCE of the pilot year to June 30, 2013. That is, anything new described in this document is slated for accomplishment after July 1, 2013. We have delayed our request for the start of new funding until June 2013 for a combination of reasons. First, our PI had not yet taken the time Mellon had agreed to fund for her to work on the project because she was on maternity leave. Second, it took a bit longer than anticipated to get UW-Madison to provide tuition remission for the graduate students who are working on this project. And third, we recognized that having UW-Madison’s fiscal year, which runs July 1 to June 30, works much better for grant cycles than any other timing, and we wanted to work with rather than against the system at our home campus. In other words, the delay is not primarily a matter of work undone, but it is primarily a matter of our realizing that we could stretch existing funds for longer than we’d anticipated, and we wanted the opportunity to do so while at the same time potentially having a guarantee of funding already on the table to continue the project into the next three years or more so that we could move seamlessly into the next phase. We have included section 3, background, of the accomplishments of the pilot year so that the new information that follows has a full context in which it can be understood.
A Recap of the Accomplishments of the Pilot Project
This section describes some of our progress towards the vision of the proposed project.
-
The ability we developed to talk across the humanities/computer science divide
This has changed the way all of our researchers look at problems, and this synergy means that we have moved in new directions in our thinking and are working together at a rapid pace despite our geographic dispersion.
-
A web-deployable text-tagging engine that replaces Docuscope entirely
It works quickly and at scale. It can use the Docuscope dictionaries as well as any other tagging schemes users find, borrow, or develop.
-
Repurposing of biology research, specifically in the modified tool DNAText
Our ability to see how words resembled genes and texts, genomes, has opened up a range of methods and software for the use of humanists. It turns out that this analogy is not merely a clever comparison but that the two domains can be visualized and manipulated in similar ways, even when what the scholars want from the software is different. Both literary scholars and biologists seek to understand pattern, variation, and outliers in long sequences. The power of abstraction, a key concept of conceptual thinking, lets us see that sequences are sequences – whether they be genes or words, and the tools for studying sentences can be general.
-
A similarity detector that works on the ECCO corpus (only)
-
A single text viewer that takes our tagging engine output and allows the examination of any single, tagged text in multiple ways
-
A corpus separator that allows us to visualize a tagged corpus (not just an individual text) from several perspectives
Each of these pieces mentioned in the table in section K is somewhere between a prototype and research quality software. The remainder of the pilot period through June 30 will involve either rewriting, jettisoning, or incorporating each of these pieces as we test their utility to our larger project.
-
Techniques for comparing humanities data from visual mapping through simple SVMs
We now know how to begin designing software most likely to produce arguments that work in both humanities and computer science realms. Right now, this stands as a series of small pieces of code that allow experiments rather than an integrated piece of software, but this work points us towards new methods that we want to incorporate into our existing and future text analysis tools that will push the frontiers of visual analysis of textual information. Between now and June 30, we will be combining these single experiments into a more integrated system that will allow us to hit the ground running during the next grant phase.
-
A curated 1000-text corpus.
A contribution that proved much more significant than we thought it would be when we proposed it is our curated 1000-text corpus. This randomly selected set of documents, tagged, modernized, and genre-labeled allows researchers to perform our tests or their own on a standardized corpus that spans the range of what was printed from the sixteenth century through the eighteenth. In generating this set, we’ve also learned a tremendous amount about early print, which we have begun to write about on the group’s two blogs, winedarksea and digitalincunabula. This dataset surpasses a similarly-motivated corpus (ARCHER), which is only available to a handful of institutions. Our larger corpus, which is also freely available, is of interest to the ARCHER scholars and other linguists who do not have ARCHER access as well as to the audience of historians and literary scholars. It also has proved interesting to computer scientists always in search of novel sets of real data.
During the time before July 1, 2013 we will be expanding the metadata (kind of labels) on this corpus as well as providing one or more additional corpora for research purposes (our own research and that of other scholars).
-
Topic models
Through an unexpected collaboration with Professor Christopher Re’s laboratory, the group also provided input into building an ECCO-text topic modeling system. While this software was not funded by Mellon, the models generated from the software belong to VEP and can be shared as well as used in developing future tagging systems and visualizations.
As we develop new tagging systems both before and after the NCE through July 1, we will be using the output from the topic modeling software as input into our tagging system.
A Review of the State of the Art and VEP’s Distinctive Contribution
-
Google Ngrams and Google Books with respect to VEP
The best-known existing effort to scale textual analysis to massive corpora is the Google Books project,1 with its associated Ngrams analysis tool. Like VEP, this project has both a curation project (an attempt to digitize the printed record) and an analytic tools development aspect (the Ngrams tool). However, the contrast in approach is important. While the Google project brings computational thinking to literary analysis, it does not explicitly consider how this way of thinking can be brought together with humanist thinking. Here, we contrast our projects directly to show that our work does not reproduce something created commercially, a comparison we find illuminating to the work we are doing.
Google Ngrams lacks several features essential to scholars, qualities central to the tools and methods we are developing. Perhaps most important is the absence of any direct route from the search results to the original documents from which the ngrams are generated. Instead, the Ngrams server allows users to click on a date range which then performs a search on Google Books containing the Ngrams of one’s search. This produces a long list of the titles of the books containing the search items, but no link to the actual contexts of appearance. This makes it impossible for the researcher to check for ambiguous or erroneous instances, or to get a speedy sense of the data (which can often prompt a refinement in hypothesis or search technique). The list, the usual output of a search on Google and in most databases, allows a very small amount of information to be seen at once. VEP’s goal is to move beyond the mere list or search as a method of discovery.
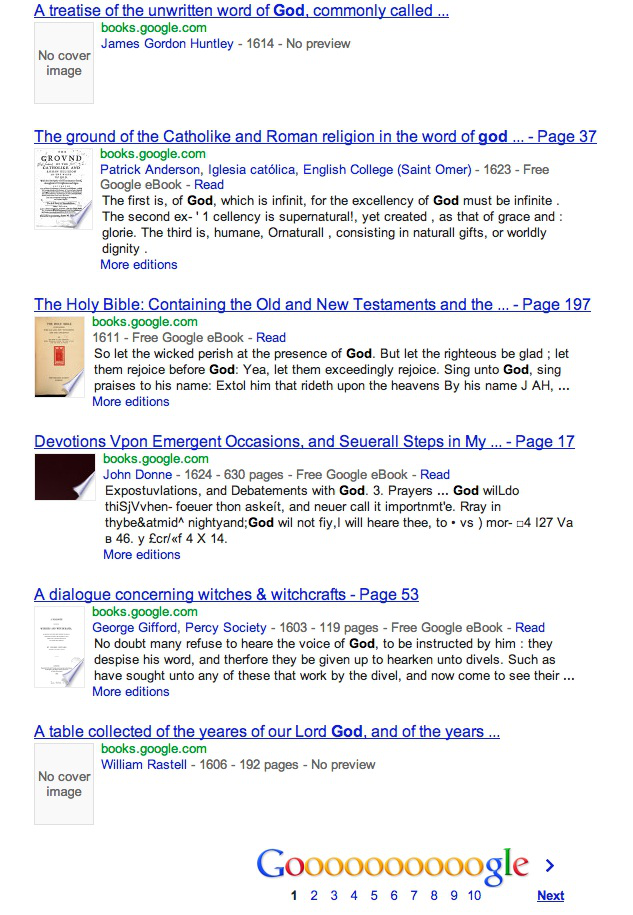
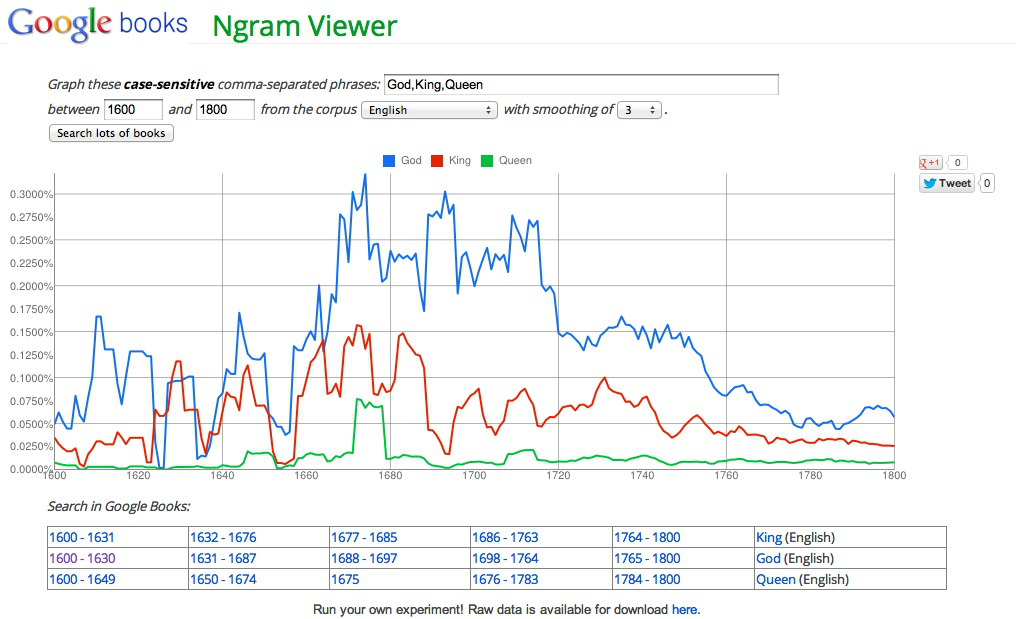
Figure 2: The list produced when the link to “God,” “1600-1631” is selected. The result is a list of 1000s of books, not sorted in any evident way, difficult for the viewer to organize and use systematically.
The architecture of the Ngrams database effectively means that each year is treated as a single “bag of words”. The user cannot compare between different works, or different types of work, making it impossible to trace trends in kinds of books published or word usage in them. Our work with large corpora has already shown that the most interesting questions lie in comparison, not just between years and time periods, but between texts and groups of texts. There is massive variation in word-use between different types of text published in the same year, and the Ngrams database is blind to this.
As has been well documented, the sources of the Ngrams database are not easy to discover, and the Ngrams database is particularly weak in certain decades before 1800. This will change as more books are added, but poor metadata means that reprints are not reliably identified: and they may bear the original date, or one two hundred years later.
Significantly for researchers doing work that seeks to be replicable, the data behind the set also changes without warning as more books are added: a graph generated today might differ substantially from one generated in a year, but the researcher will not be able to see why.
We do not dismiss Google Books out of hand. The Ngrams viewer is useful as a tool for testing hunches. As background data, as a rough approximation of when words are used in printed materials, the Ngrams server has value. A search in Google Books can provide hints as to the first use of a word. It can also be taken as an approximation of the ranked popularity of words and phrases in general, in the years when the sample size is sufficiently large. VEP uses a downloaded set of Google Ngrams as a test case for some of our software, but to do so, we need to curate and design new analytical tools that make the data work for us.
Nor do we join the general clamor in faulting this data set for its errors: any large dataset has errors until curated, and even then some remain. However, since the sources of these errors cannot be corrected in an ongoing manner, a researcher needs to freeze the Ngrams data at a particular moment in order to curate and continue to use it, while the dataset at Google may continue to change without being marked. VEP is committed to curated, marked-up datasets that can be used as benchmarks.
Our work general seeks to complement Google’s efforts. Whereas their work focuses on using trends in word usage to understand culture at a very large scale, our focus is on providing tools that directly support literary scholarship.
Some of our work has (and may continue) to use Google’s data sets. For example, Gleicher, Valenza, and Witmore experimented with simple visualizations to seek patterns that suggest what words might be interesting to explore further.
We have also explored using tools designed for biological applications with the Google Books data. Sequence Surveyor is a project in Gleicher’s group to develop tools for visualizing overviews of large collections of (initially genetic) sequence data, aiming to support the discovery of patterns and outliers. To test the tool, we applied it to the Google Books data, using the lists of ranked words as sequences. It allows the user to see changes in word usage over time and also allows users to track an individual word or set of words over time. This application was sufficiently interesting that the tools was further adapted the tool, creating a variant (known as TextDNA) specifically for exploring word rank sequence data. One key feature of the tool is that it enables the comparison of different data sets at the word level. If we have a curated set of data, say, all the novels published between 1700 and 1900, we can use the Google Ngrams set as a backdrop against which we can compare the frequency of word appearances in novels to the frequency in the whole Google corpus. Although the ideal way of generating this comparison would be to have full-text access to every book published during these two centuries, such a dataset does not exist. Thus the Google Ngrams can be used as a temporary stand-in for print culture over this time period before something more reliable is generated. What we learn about this particular comparison is that first person singular pronouns occur as one of the top five words in novels of this period; whereas, this pronoun does not register at all in the top 500 words in most decades, and when it does, it is relatively infrequent. This tool allows nuanced and configurable views of word frequency; the one example shown here does not do justice to the range of what the software can show, but the example does point to the kind of discovery enabled by user-configurable visualization software for text analysis. The tool has the particular strength of making visible outliers and otherwise unexpected words, one of the core ways that digital analysis of texts serves as a first step or an initial inspiration for scholars without replacing the expertise of scholars in interpreting what these apparent anomalies mean.
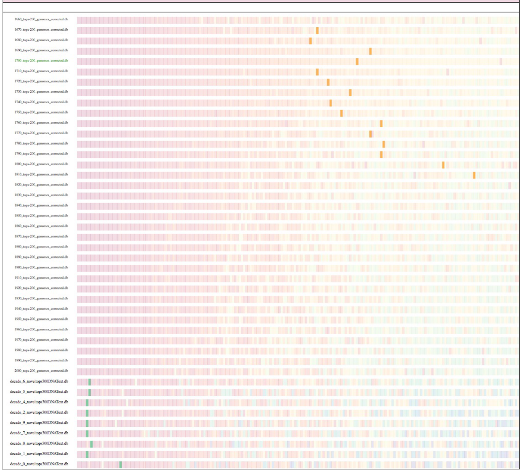
Figure 3: VEP’s TextDNA tool run to compare word usage in novels (the bottom 9 rows of the image) to word usage in all books (or, rather, the approximation of “all books” made by the Google Ngram dataset, represented here in the top 35 rows). The green boxes at the bottom left represent the use of the pronoun “I” in novels. The orange blocks represent the popularity of “I” in Google ngrams, divided by decades. (The other boxes have been faded out to make the pattern clear.) Occurrences of the first-person singular pronoun is the only dramatic difference between novels and printed material more generally, pointing to a hypothesis that the novel’s connection to the speaking or writing self is deeply bound up with the language of this genre.
-
Proprietary Databases, Google, and VEP
Proprietary databases such as EEBO (Early English Books Online), ECCO (Eighteenth-Century Collections Online), or Evans (American books from the beginning of the printing press in the United States), are open to many of the same critiques, except that some of them do have better connections between hits and texts. For this reason, these datasets are models for what we aim to create, but as with the Google ngrams data or Google Books, we need to download and curate this data for use rather than relying solely on their internal search functions. None of these databases have analytical or visualization software built into them the way that Google Ngrams does, nor do they make versions of their files freely available for download as Google does.
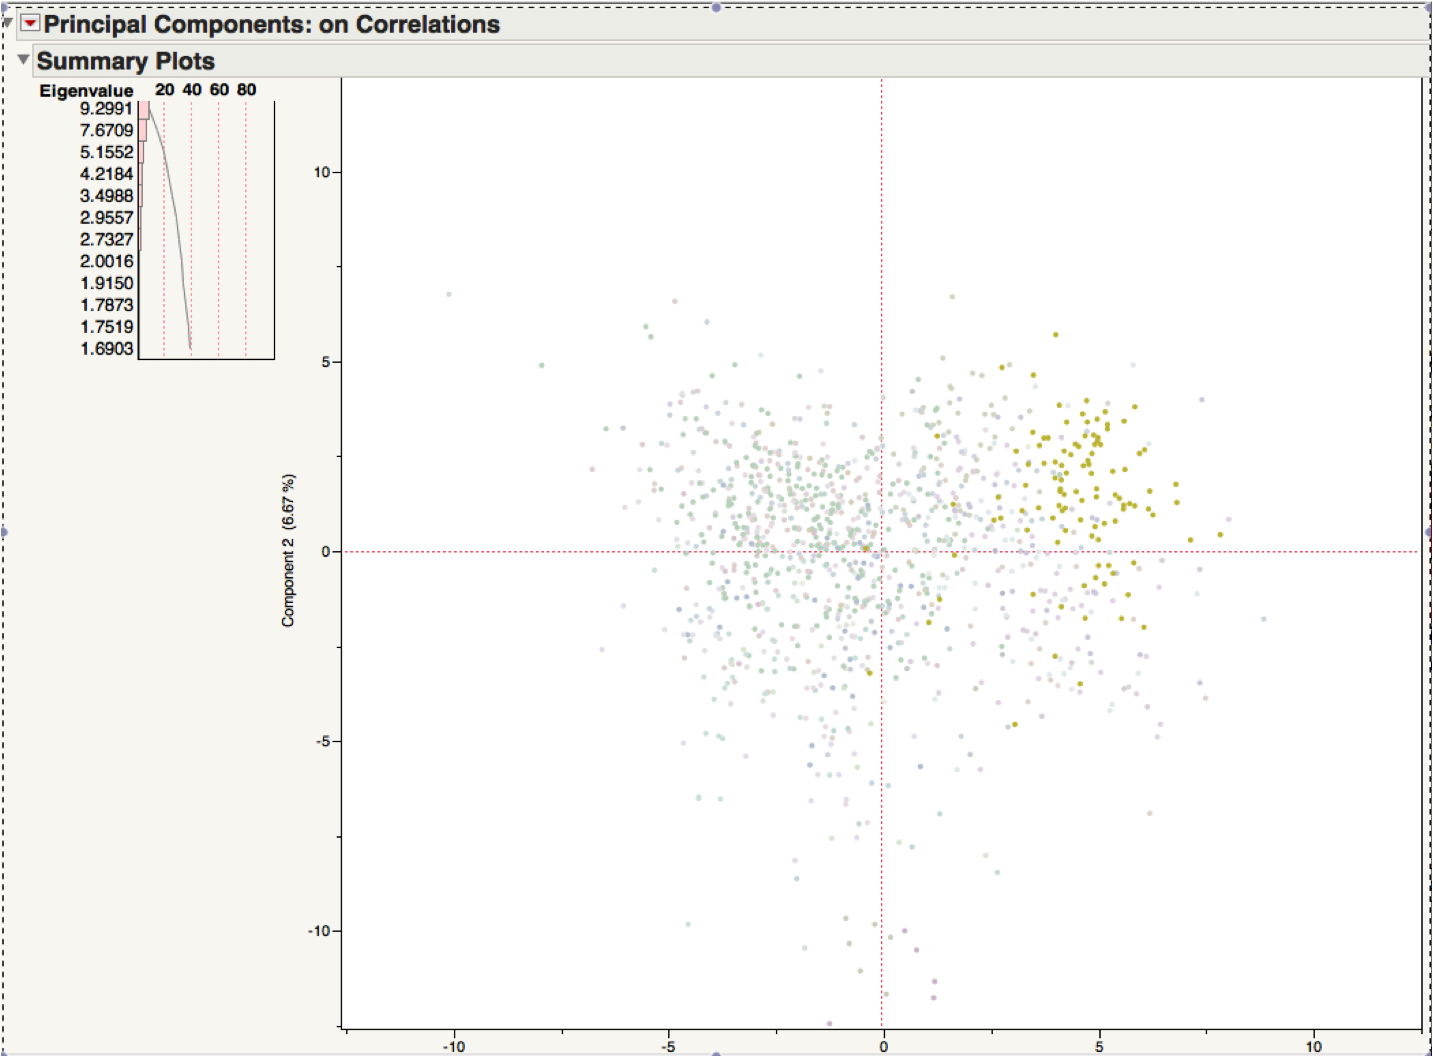
Figure 4: Graph of the 1000-text corpus by genre. The darkened green region shows the literary texts from our 1000-text corpus, suggesting that there is something distinctive about the literary that is not true about early modern print as a whole.
Research Overview
We have divided our discussion of our research into four sections that represent a division of our research into its subsidiary parts. The first discusses how our work at scale will generate new approaches to humanities research and speak to hitherto unanswerable questions about print culture. The second, Text Quantification, describes the intellectual work behind transforming millions of words into numerical vectors that capture useful information for computerized analysis and visualization, the topic of section three. Section four discusses the intimate connection between working at larger scales of analysis and the need to have texts made available for this scale. It also touches on the perhaps surprising benefits that flow from the methodological design and implementation of parts two and three.
-
Approaches to Print Culture Enabled by This Research
VEP’s initial proposal emphasized our role as a problem factory for humanities questions writ large. Below are sample questions that underwrite our next phase of research, questions we believe will be the ones to which scholars increasingly want answers.
-
Do cultural forms of classification (such as genre) exist in a scientific sense? Can these be formalized and quantified, allowing us to map large corpora of texts automatically?
-
Is time the key variable in any kind of analysis we attempt, and if so, can we find the “sweet spots” in which other variables (authors, genres, geography) become identifiable or dominant?
-
How does one enable a scholar to look at more than one text at a time in a way that is an improvement over having five windows or five books open on one’s desk? Put another way, how do we link multiple texts so that moving (or scrolling) through multiple texts simultaneously makes intuitive sense?
-
How do we abstract texts so that we can analyze them at scale? What ways of turning words into numerical vectors yield the most compact form that produce the greatest separations in data sets? In other words, how do we use the fewest variables and lose the least information?
-
What existing technologies can we repurpose for the study of books? Or, similarly, which subfields of computer science bring the most knowledge to bear on the problems we are solving?
These questions will be deployed, in part, by connecting them directly to questions that have long consumed humanities academics: What is the prototypical novel of the eighteenth century? What are the ways in which Hamlet was pirated? What textual influences mark Burke’s Reflections on the Revolution in France?
-
-
Text Quantification
The core of automating literary analysis is to abstract the texts into a form about which we can reason. While it is conceivable that one day we will be able to use computational natural language processing approaches and other deep understanding tools for such problems, for the foreseeable future, automatic text analysis will not be able to reliably discern many higher-level structures in text. Human skill has the advantage in creating deep understanding of text. Thus, we keep the text analysis simple so that it can be easily understood and explained in the form of broadly intelligible, reasoned arguments. Machines have the advantage at assessing surface level features of text. Counting words can be performed robustly, efficiently, and at massive scale by computers. Unlike deeper analysis, counting can be reliably traced back to its source, affording easier multi-scale analysis and making the proof of reasoning easy to follow.
Our approaches to text quantification effectively translate to counting words (or short sequences of words). We identify two major types of “counting:” tagging and word spotting. In word spotting, we seek to count specific words, with an emphasis on identifying specifics. In tagging, words are grouped into a small set of categories, and we count the categories. For historical reasons, we call the names of categories “tags.” The set of categories used is called a “tagging scheme.” While tagging schemes may grow in the number of categories considered, this number is by definition far smaller than the number of possible words.
To understand the difference between these types of counting consider that a text may have thousands (or tens of thousands) of unique words. A word-spotting-type counter tries to capture this diversity, providing a count for each unique word that appears in the text (or corpora). In contrast, a tagging scheme replaces each word with one of a small number of tags, so the result is a count for each of these small number of items. Both types of counting are useful: word-spotting enables reasoning about specific words, whereas tagging allows reasoning among texts even if the details of the specific words used are different.
In our pilot project, we have gained an appreciation of the value of the two styles of word counting, and their importance in analysis relative to the deeper understanding types of computational text analysis that is common in computer science. We see the need for tools to support both types of counting. We also see the challenges in providing robust text quantification tools for large-scale analysis of historical corpora. Quite simply, even counting specific words is challenging in the face of transcription (OCR) errors and non-standard spellings.
Fortunately, our pilot year has also identified potential solutions for the challenge of word quantification in large historical corpora. First, probabilistic models offer a computationally challenging, but conceptually attractive, way to reason about the uncertain noise from OCR errors and spelling irregularities. However, we have not yet begun to see how to realize such models in our own work. Second, we have found that simple, practical modernization tools offer a workable solution. While third party open-access tools such as VARD 2 may not provide perfect performance, they can be good enough to clean up problems to afford analysis. Third, we have discovered that we need not have perfect quantification in order to perform meaningful analysis. By building the robustness into our analytic processes, we can accept good enough textual analysis.
Prior to our pilot project, much successful work using a text tagger used the Docuscope system from Carnegie Mellon University. The tags in Docuscope come from a manually-curated dictionary, developed by a language scholar over a decade. The software that makes use of this dictionary attempted to merge quantification and simple analysis. The Docuscope system has a number of pragmatic issues that made it ill-suited to scale to larger scale efforts. First, the dictionary is proprietary and the authors desire to carefully protect it. Second, the software was designed for interactive use on short essays. It is not capable of processing a long novel, never mind batch processing a large corpus. Third, the tool integrates poorly with other analytical tools.
To overcome these practical issues, we have built a prototype text tagger that is compatible with Docuscope. The prototype, named “DSJ” (the name is an anachronism) specifically intended to address the three issues. It is web deployable, so that the proprietary dictionaries reside on the server (unavailable to the user). Our agreement with the dictionary author allows us to provide such functionality of the dictionary, but not the dictionary itself. Second, the tagger is efficient and runs in batch mode. It has successfully (and in an unattended fashion) processed non-trivial, 1000 or more text, corpora including very long documents. Third, the tagger is constructed in a modular manner, and can create a variety of output forms and affords user-defined dictionaries.
The process of developing DSJ exposed other issues that we must consider as we attempt to use tagging as a step in scholarly research. Docuscope program did not correctly implement what the designer thought it would. The implicit design decisions in Docuscope were based on assumptions of how its dictionary was to be constructed: the designers never considered the range of potential designs for other taggers, or made explicit the decisions that may limit the kinds of tagging schemes that may be used with the system.
This experience in developing DSJ leads to two critical aspects that we must consider if we are to make text tagging a viable research instrument. First, we must be able formally and explicitly to document the tagger’s behavior, so that users can rely on its behavior and recreate the tool if necessary. Part of this includes providing validation that our implementation of our tagger correctly realizes the specification. Second, we must understand the design space of tagging architectures and make explicit the design decisions in our implementations. Only by creating such a formalization of the tagger can we truly make it flexible enough that users can create their own dictionaries and otherwise tailor it to their needs in a reliable manner.
In this project, we will build a set of flexible, efficient, scalable text quantification tools. These tools will be web deployable, and integrate with other elements of our project. Significantly, these tools will be defined formally such that their behavior is specifically characterized and tested. A user will be able to know exactly what the quantification tools do, and why. A suite of regression tests will insure that the tools are reliable.
The current tagging schemes have been developed using the English language, but the engine itself is language-agnostic, so other human languages can be swapped in for English for other researchers. This is something that this group of researchers hopes to encourage future collaborators to undertake since it is beyond our immediate expertise, but is something that we can aid and support. (Certain tagging methods, such as randomly generated word clouds and word frequency analysis are already language independent – all that needs to be added is a file of language-specific stop-words for new languages.) Similarly, tagging schemes that are aimed at visual data will work with some modifications to the software. This is not VEP’s first goal, but by working with image analysis groups in the future, integration of the tools is a much-desired outcome. We project that this will be a feature of the third year of the new grant period, and we will during the first two years of designing, presenting at conferences, and holding workshops target groups working on these other areas so that we will be prepared to build the pieces of our engine that will facilitate integrative work.
-
Analytical Methods
Having a prototype text-tagger that scales to non-trivial corpora and creates output readily used by standard statistical software has allowed us to apply the arsenal of available analytics (e.g. statistics, machine learning, and visualization). For example, it is easy, almost inconsequential, for a scholar to press a button and perform a hierarchical clustering and draw a dendrogram – without ever considering whether the metric utilized is sensible, whether the results are significant, or whether they have chosen a reasonable algorithm. Performing post-hoc examination inevitably leads to arguments, but the arguments produced often seem a bit like a Rorschach test in which a scholar will find patterns in his or her results that reflect more about his or her way of thinking than about sound statistical inference. Making more powerful analytic tools and larger datasets available to scholars adds to the risk of naïve application. While our pilot project has had some interesting success with applying conventional analytic tools to tagger data, these efforts have also highlighted the need for a new generation of analytic methods that specifically support humanist thinking.
In the pilot project, we have begun a number of efforts for improving the analytic tools available and making them better support humanist thinking. Each of these efforts spins out a thread of the project: to develop the techniques, to realize them in deployable tools, and to demonstrate their value in large-scale textual analysis.
-
We need to mine the available analytics arsenal for appropriate tools, and understand their ramifications for textual analysis. This effort includes finding ways of explaining their technical issues to scholars so that they may be used responsibly, automating their responsible usage to raise the likelihood that they will be used in a sound manner, and making the best-of-breed methods/best practices easily available so that scholars will use them.
-
We need to develop techniques for addressing the multi-scale nature of literary analysis, providing couplings between the large scale phenomena detected by statistics and machine learning and specific examples illustrating their manifestations. This requires not only better text visualization tools but also mechanisms and workflows that connect textual detail to larger scale processes.
-
We need to develop new analytic methods that better support humanist thinking. We need new methods that can directly utilize the expert background knowledge of scholars, that can more directly support the creation of arguments, and that provide large-scale analyses in literary, rather than statistical terms.
Each of the following sections considers one of these interwoven threads, illustrating our pilot successes as well as our plan to develop the techniques and tools in the future project.
-
Applying the Available Analytics Arsenal: Responsible Use of Statistical Tools
Our ultimate goal is to provide tools to users who are untrained in statistical methods. . We note that the ability to create “easy to use” software can put advanced statistical techniques in the hands of people without experience with and understanding of statistics. The ability to use statistical methods, therefore, can be de-coupled from having the sophistication to use them responsibly, for example, to have the intuitions of the models and an understanding of the corollaries of their use. We also note that the sophistication of a user to responsibly use advanced statistical methods is different from the statistical training required to implement them.
Our challenge is therefore twofold: we must put powerful statistical methods in literary users hands, but also enable them to make responsible use of them.
Our approach to this takes many tacks. First, we hope to develop best practices by performing literary analyses in consultation with professional statisticians, mathematicians, and computer scientists who have understandings of the statistical methods. Although our research group is statistically savvy, we would like our work 1. to meet the standards of statistical professionals (those who work in the field and/or have advanced degrees in the subject), and 2. be easily explained to those who were not especially well-trained in statistics.. Combining one and two is hard, but we deem it necessary to a successful project that is intellectually sound. Going forward, our classes for graduate students in “distant reading” will include a unit on statistics run by a statistician (we are interviewing candidates currently), followed by, we hope, curricular changes that requires students involved in this research to have one or more stats classes under their belts. We plan to make such practices as easy to implement as the current ones, including making clear which numbers should be reported to support claims, documenting what tests should be applied to understand if the methods are appropriate, and explaining what conclusions can actually be drawn from the various methods. Second, we plan to make such practices as easy to implement as the current ones, including making clear which numbers should be reported to support claims, documenting what tests should be applied to understand if the methods are appropriate, and explaining what conclusions can actually be drawn from the various methods. Third, we intend to develop new techniques that automate the parameter tuning and other internal details into which a novice user is unlikely to put significant effort.
One specific example that we will consider is defining the distance metrics used in the tools. Many analytical tools rely on a metric: a function that measures the distance between two items. Hierarchical clustering (to make dendrograms), K-Means clustering, Principal Components Analysis, and 2D layout2 are examples used in statistical literary scholarship where the metric is the core element. When texts (or portions of them) are considered as vectors (that is, when texts are converted into a set of numerical categories as they are, for example, when they are tagged), there are many possible trivial distance metrics, as the default metric in this category is usually the Euclidean distance. However, the use of such metrics is known to be problematic in high-dimensional spaces: the way we consider distances in 2 or 3 dimensions do not extend well to 100 or more dimensional spaces. (These dimensions are best imagined as mathematical constructs; they do not represent real space and thus are difficult to picture in one’s head much less see in the world. If each word can be assigned to one or more of 100 categories, then it is a vector with 100 dimensions.) The assumptions that we make about the dimensions, for instance, that each dimension is of equal importance, rarely apply. A key to the sound application of analysis to tagged text data is to understand what metrics are appropriate and when. This requires choosing from existing metrics and developing new ones. We will do this through an empirical assessment of known approaches, as well as by developing new semi-supervised methods that incorporate the expert user’s prior knowledge. Semi-supervised is a technical term with a fixed definition in computer science circles, and thus we include it in the glossary. However, even though semi-supervised has a definite meaning, we emphasize that there is not a single “correct” metric: there are many meaningful ways to measure distance. We need ways to find these different useful metrics, as well as methods to specify which ones we want.
In addition to placing common statistical operations like clustering on a more sound footing, having good distance metrics provides direct intuitions for literature scholars. It allows us to consider questions involving the “closeness” of text. For example, we can ask “what are the closest k texts to a given example” (that is, we perform k-nearest neighbor queries). It allows us to define maps, where texts are placed into an image such that they are close (in the 2D image) to the other texts with the most similar metrics. Mapping of a complex, high-dimensional space (such as words with tags attached to them) to a lower dimensional one (like x and y coordinates in an image) is known as projection.
-
TextViewer and Beyond: Connecting Analytic and Visualization Tools to Words on a Screen
Our initial pilot work confirms the importance of providing connections between the large-scale statistical analysis (such as produced by the tools of the previous section), and the actual words in the text that serve to form those patterns (or are representative of them).
-
The Explainers Effort: New Analytics Designed for Humanist Thinking
Standard analytic methods allow for describing complexity in statistical terms. Humanist thinking prefers to think in its own terms, those that are relevant to the analysis at hand and which fit in with the accumulated knowledge of the scholar. We envision a new type of analysis that allows the large scale analyses to be performed with the user’s own terms, allowing them to use their expert knowledge to organize the collection.
The examples we give here are from relatively small corpora such as Renaissance drama that our target audience knows well so that this audience can evaluate the reasonableness of our method and claims. We acknowledge that this level of analysis is important in persuading users that the larger-level analyses of books they have not read can be trusted.
For a simple example, consider analyzing Shakespeare’s plays, treating each act as a vector (its tag counts). Statistics allow us to look at properties of this data, for example the axis of greatest variance, and we can then post-hoc see if this aligns with anything we may know. Instead, we envision a different workflow where the expert knowledge is used to inform the analytics, and to allow the creation of descriptions in domain terms. For example, we might want to consider the “comedyness”3 of each play. At the surface, the concept of comedyness may seem challenging to define at all, never mind mathematically. However, it has a clear, functional definition: comedyness is the property that comedies have more of than non-comedies. Since an expert user can identify comedies and non-comedies, we can leave the task of determining what this property is to the analytical method. We call this approach an “explainer” since the analytics focus on explaining facts given to them.
Explainers offer a novel way to think about analytics that are potentially much better suited to humanist thinking. They are flexible, as a user can easily provide whatever knowledge they want to use to the system, and can provide different information to view the data in different ways. These specifications need not be complete: a user can specify what is known, with an attempt to organize the unknown around these. It allows us to phrase questions in these new terms (e.g., “What is the most comedic of the plays?” or “Does comedyness manifest itself in individual acts?”) It offers to provide explanations of the terms of interest (for example, what properties cause something to be a comedy?). This last concept is significant: it offers a literature scholar a chance to critique the soundness of analysis on humanist, rather than mathematical terms. The scholar can consider the explanation and ask the system to show specific textual exemplars that support it. (See Figure 2 – the text viewer image.)
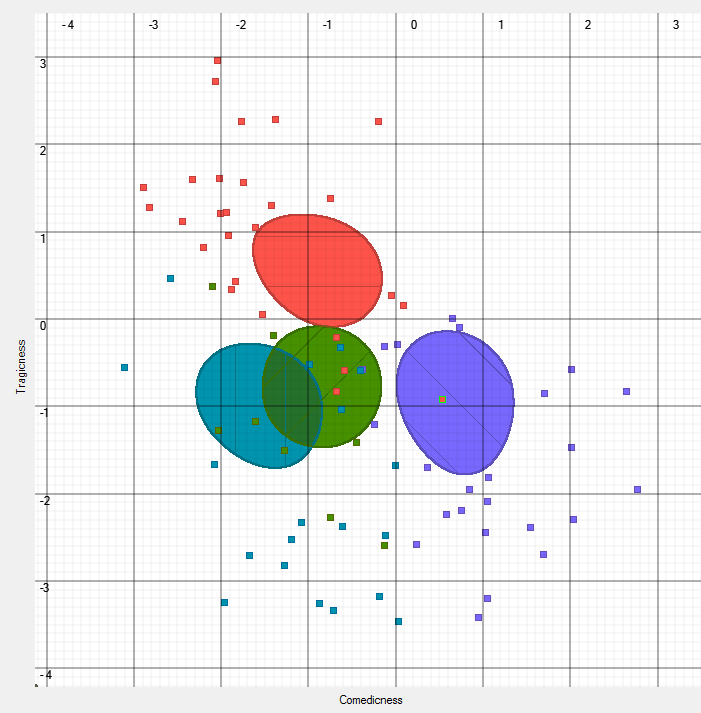
Figure 6: A splatterplot positioning the acts of Shakespeare’s plays (180) along the axes of “Tragedyness” and “Comedyness.” By definition, the comedies (purple) generally have more “Comedyness”, and the tragedies (red) have more “tragedyness.” However, from these definitions we can see interesting things emerge. For example, note the red point(e.g. an act of a tragedy) that is in the lower right quadrant (e.g. comedic, and not tragic). This point, representing Act II of Romeo and Juliet, despite being labeled as part of a tragedy is shown to have more of the properties of a comedy. What may be more surprising is that many of the early acts of tragedies are correctly identified as having “tragedyness” despite the fact that the genre of tragedy is typically defined in terms of its endings. This type of analysis also allows us to ask questions such as “what act has the most Comedyness.”
While our initial explorations with the “explainer philosophy” has been applied to defining axes (like comedic or tragic) or measurements for properties, it can also be used in the development of metrics (see discussion above). Rather than defining metrics only by the statistical properties, new methods can adapt metrics based on hints given by the user. These properties can be given in the users’ terms: rather than requiring some observations of the nature of high-dimensional space, the user can specify things such as “these two texts should be similar” or “text A should be closer to B than to C.” The idea of building metrics based on such user-level guidance is known as metric learning. These techniques have not, to date, been applied rigorously to visual analysis.
A related set of approaches have incorporated the idea of user interaction to guide the creation of projections. With techniques such as Local Affine Multi-Dimensional Projection (LAMP) or the work of Endert et al.,4 users can place points (representing texts) on a map (a 2D projection of the high-dimensional space), and the system positions the remaining points accordingly. Such user-guided map making is a valuable tool, and we intend to provide such approaches in our systems. Indeed, such approaches inspired Explainers, which may be viewed as a generalization. However, a key difference between Explainers as we envision them and the existing interactive map building approaches is our focus on providing the user with the explanations of why the system explains their knowledge the way that it has. Also, by actually constructing metrics, rather than just the resulting projection, we allow the metrics to be used for a broad range of uses (such as nearest neighbor queries and clustering).
One of the main things the pilot year taught us is how tagging works practically and statistically and how to design software to maximize what tagging can tell us. The next steps are to add different tagging schemes we develop, including the ability to handle probabilistic and multiple tags, and various mathematical and statistical options for producing output based on tags. Thus, the subsequent phase of development requires generating explanatory features that exploit semi-supervised learning, nonlinear methods, and probabilistic methods for inference that complement the linear methods already in use. Given that we also have a knowledge-base generated by experts and experts sitting in front of the tools, we also need to design dynamic metrics: a user chooses a set of points in a visualization or in a database file and then asks what these points have in common. In turn, these dynamic metrics can be revisualized, positioned atop an original visualization for comparison or put side-by-side with the original as a new image.
Thinking of visualizations as a set of overlaid transparencies allows us to introduce into the next round of development the ability to remove one or more layers (such as a particular type of data points, say, the ones that represent verbs) thereby reducing complexity so the user can find what he or she wants to discover in a complex picture. Reduction of complexity lies behind much of what any discipline does when it creates models or quotes from short passages; however, we do not want to prescribe in advance which way a user will want to reduce complexity. Moreover, because the images are dynamic, a user can compare two graphs and push a button to have the distance between the two quantified. This is a concept unfamiliar to humanities scholars: the ability to see precise distances between texts or textual features. This insight arose from the interplay of computational and humanistic thinking within our group. It is one thing to say that the so-called bad quarto of Hamlet differs from the first folio’s version; being able to measure and then articulate what the differences are at the level of the language is another. It is a given that Shakespeare’s play Hamlet and Ambroise Thomas’s opera Hamlet are similar, but visualizing and measuring their differences provides new scholarly information about what, for example, the introduction of new characters does to the plot. Such questions can also be translated to ones at a larger scale (Hamlet has hundreds of full or partial imitators), but these questions allow us to demonstrate the value of our software even on texts known well to experts.
The other major lesson we have taken from the pilot year is that we will not know in advance precisely what a user wants to emphasize while using our software. Thus, the software needs to be tunable. We use this metaphor drawn from analog electronic devices deliberately: software requires knobs for adjusting the user’s priorities: Does the user want outliers emphasized? Does the user want to tolerate a degree of noise to make sure not to miss potential data? Behind the scenes, this requires, for example, calculating confidence measures for the data, in particular in cases in which the data is un- or semi-corrected OCR. The data we generated for the pilot year will become the basis of these confidence measures. Although this view of the information is not displayed to the reader, this diagram shows how confidence in the dirty data can be pictured. This simple tool, a heatmap, is both useful for its output and by the way it allows users to learn about confidence measures.
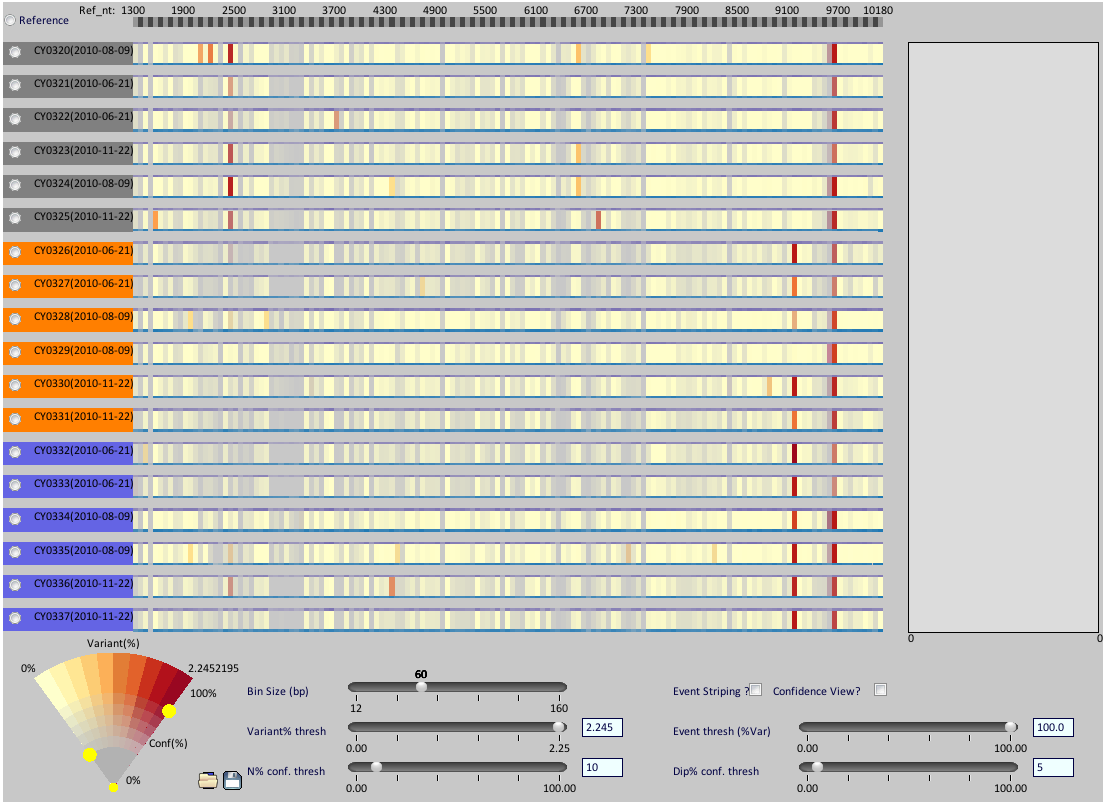
Figure 7: A representation of “confidence fog” on a sample dataset. If the variable, n, is the number of words with a certain tag in an uncorrected OCR-generated data set, as n decreases the number of n events in the dataset decreases; however, the presumed accuracy of the data (or the confidence threshold) increases. As the confidence threshold increases, uncertain data fades into the background, enacting a visual metaphor in which uncertain data recedes into the fog of the background.
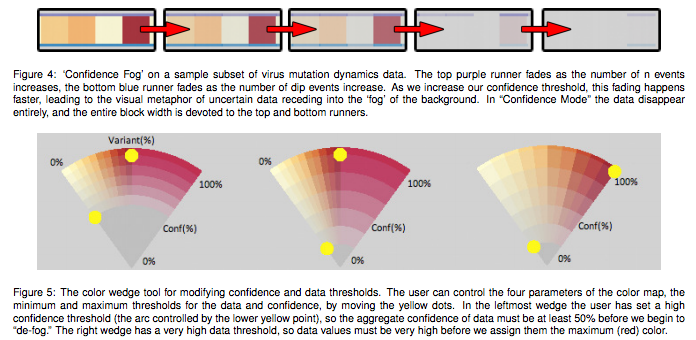
Figure 8: The color wedge tool for modifying confidence and data thresholds. The user controls the four parameters of the color map, the minimum and maximum thresholds for the data and confidence, by moving the yellow dots. In the leftmost wedge the user has set a high confidence threshold (the arc controlled by the lower yellow point), so the aggregate confidence of data must be at least 50% before defogging begins. The right wedge has a high data threshold so data values must be very high before they are assigned the maximum (red) color. Figure 4 shows how such a color wedge determines the coloring of the data visualization.
Now that we have a prototype web-deployed text tagging tool that creates output both in the forms of files that can be read by standard statistical software or by our own software, the next step is to give the user the ability to swap in and out methods for placing texts on a visualization either through tuning, through menu selection, or through visual interaction. This proves crucial to a robust and useful visual analytic tool. To make this user behavior possible, we will leverage both expert knowledge and machine learning techniques to propagate what we know to what we do not know. For example, through spatial learning techniques, our software would automatically locate hotspots where something likely to be of interest to the researcher is happening. The software would also embrace the visual context of the user working with the screen such that scholars can manipulate what they can see on graphs directly (rather than adjusting a series of parameters that are not in themselves visible). Information collected from these interactions can then be used to improve the model underpinning the tools’ visualizations. This kind of learning is often labeled metric-learning based layouts, which includes among other strategies, Endert and North techniques. (See figures 7-9 as examples of confidence threshholding that can be extended into metric learning layouts.)
We need nearest-neighbor calculations and visualizations: if a user chooses a single text, he or she may then want to see on the graph or as text the texts that are most like that text. K-nearest-neighbor techniques or k-clustering turn out, in our domain, to be closely related to search. Thus we need to implement various search techniques, including ones based on an index of data, ones that look more like a standard search engine, and methods of visual search. For example, if a user wanted to know the ten nearest neighbors of Paradise Lost, he or she could specify the initial metric that determines distance. One possibility would be to choose a metric that says that if two texts share words relatively uncommon in the database at a higher rate than any other text paired with Paradise Lost, the second text is the nearest neighbor of the first. This is repeated k times to find the k-nearest neighbors. Alternatively, the user could search for the point on a graph that represents Paradise Lost, and highlight the region around it to discover what texts are the nearest neighbors. At this point, the user will often want to see the neighboring texts with the reasons for counting two things as similar marked.
This research agenda incorporates the development of a suite of integrated, web-served tools that advances literary discovery at scale. These visualization tools encourage the kind of thinking that the group is pursuing in many different ways, and that VEP has made and will continue to make available to other researchers to work on this and other corpora of data. As projected in the pilot year, with each passing year the software is expected to handle an additional order of magnitude of data, and each increase comes with a corresponding decrease in the quality of the input data, for which the software needs to compensate using statistical methods.
We plan to include in our tools more standard text utilities as well, including fulltext search, metadata search, and version control with differencing.
-
Generating data sets for the use of researchers
Curating at scale requires the same reorientation of perspective for humanists, and it entails similar challenges as analysis at scale. To state what is perhaps obvious, hand-built variorum editions are not possible for a million books, nor are automated attempts at hand-tagging and labeling. Crowd sourcing is one way of approaching part of the curational task, one whose results we are waiting to see from the researchers at Northwestern and Texas A&M. We will use their results or software as it becomes available to compare to our own using our tools, but we also are pursuing semi-supervised methods for automating curation using the technologies we are developing for moving textual analysis to larger corpora.
The Archimedean task for VEP here is to find the standpoint from which to move humanities scholars towards understanding their books as data. This is not to fault scholars, but rather to emphasize that this approach requires a Galilean change in worldview. Our first step is to put researchers in a position to comprehend and subsequently use the sample data sets that we have generated. Given this, it becomes easier to show how curation of a data set is inextricable for analysis of that data set, and that tools designed for analysis and visualization are equally tools for curation and vice versa.
Our tools are part of the curatorial cycle because the scale questions we ask apply to curating data as much as they do to analyzing it. Thus, we generate curated data sets while specifying best practices based on what we have discovered and continue to discover from the data and our analyses of it.
-
Controlling for Consistency
Data as it is found in the raw on the web or through specialized, proprietary or open source databases varies considerably in reliability and form. Even TCP text, generally considered to meet the highest practical standard for textual data because they are double-keyed, are not easily amenable to computational tools because of variation in spelling and other properties of pre-1650 texts.
We have begun to bridge the divide between raw OCR texts and hand-keyed ones in our experiments by relying on software that employs methods of semi-supervised learning for OCR accuracy improvement (we have not yet implemented our own version of semi-supervised learning) and the laws of large numbers for overcoming statistically the OCR mistakes. (The basic principle here is that errors tend not to recur as often as correct words do; setting thresholds for the number of times a word must appear to register as a correct word allows us to work with less than perfect texts provided we have a sufficient number of them. As the number of texts rises, the better this assumption holds.) This means that for our experiments we need not detach time periods from one another in order to study them: we can move from diplomatic quality transcriptions from 1470 to OCR documents from the eighteenth century and beyond without having our systems break down.
All this said, we will continue to ingest higher quality texts from groups such as Laura Mandell’s as they make them available to us; by the same token, we will begin providing the automatically and hand-corrected texts produced at Wisconsin through Christopher Re’s lab at UW-Madison to other groups that want this data. This form of collaboration will take the form of file exchange at regular intervals; it involves no particularly complex mechanisms – a dropbox or hard drive is sufficient.
-
Discovery
A crucial example discovered in the pilot year that guides our commitment to curate at scale is one that revises the history of the English language substantially; and it also generates a new founding principle about the English language that scholars of the history of English or of print culture in the seventeenth and eighteenth centuries must now take into account. The longstanding story of the history of English tells us that the language standardized in spelling and usage somewhere around the mid-eighteenth century after the rise of the dictionary and in particular, Samuel Johnson’s 1755 and 1756 (abridged) compendia of the English language. However, any experiment we ran on the English language told us that nothing particular changes in English at this mid-century moment. Indeed, the more tests we ran, the more we found that after 1650, any standard dictionary from the nineteenth century and later recognized the same percentage of words in English during every decade from 1660 to 1800. More focused tests showed us that the sea-change was a product of the 1640s – a full hundred-odd years before the standard story would have it. Figure 3 represents both this information and a quintessential example of how thinking across the computational and humanistic divide has worked.
After a freely available early-modern text modernizer, VARD 2, is run over the data, the contracted elbow between 1640 and 1650 smoothes out. That line tells us something else: the rate of change of vocabulary in English, once early variation in spelling is eliminated, is steady. This is a common-sense assumption about language made at least since the seventeenth century in England, but it has been difficult to demonstrate with concrete evidence.
This set of experiments illustrates the cross-pollination that marks the productions of the Visualizing English Print research group: first, matters that seemed to be insurmountable problems can be measured and adjusted so that crucial information comes into focus, and second, existing methods and software can be brought to bear on some questions in new ways.
We include this description here rather than in our work accomplished section because this discovery and related ones shape what we need to do in the future in generating data sets. That is, we have to treat 1640-1650 as a point at which we have a period change in data, and this does not fall either within one of the traditional explanations or on one of the conventional boundaries of literary periods. Similarly, standardization of fonts around 1710 or the loss of the long s just before 1810 have been discovered or confirmed by software and need to become integral to the creation of data sets. It is also something that needs to be built into our future tools so that they work on other data sets that users bring to the software.
This is where using software like TextDNA to make visible systematic patterns, or more trickily, semi-systematic patterns is central to our work. At scale, we need to take this a step further, which is to dive into semi-supervised learning in which humans go over a certain number of texts, and then the software devises probabilities for making corrections to the whole. Keeping these probabilities – rather than making a solid and perhaps incorrect decision – will be a distinct contribution to curation. It recreates in some manner, the work that scholars have done for centuries in noting variant texts in footnotes, so that the user has all options as possibilities. Keeping the knowledge that in this situation, it is 75% likely that the word in question is “case” and 25% that it is “café” based on previous cases seen will allow our software to employ confidence measures, which we make use of elsewhere in the software. It also preserves information that we do not want to lose, which in past approaches has been discarded. This improves the user’s control over how the data is used by allowing him or her to set thresholds (as described above) for the way data is visualized.
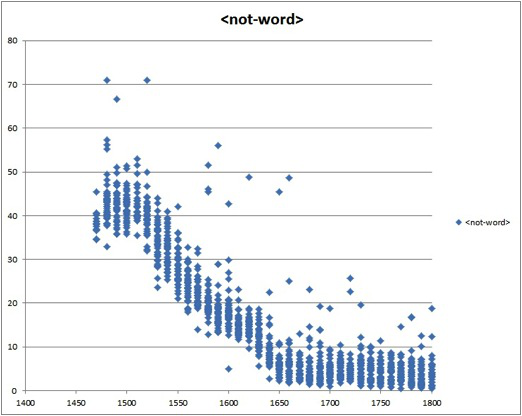
Figure 9: The graph is an extraordinarily clear rendering of a humanities problem interpreted through statistical techniques. It was generated to pinpoint the date before which any software that did not account for tremendous variation in English spelling would not produce reliable results. The need to account for spelling change is a problem that has been discovered many times over by literary scholars; however, the act of using large-scale data to graph when the scores of spellings of “advance” no longer need to be taken into account required particular kinds of conversation between literary scholars in which the computer scientists generated a measure of the “incorrectness” of English. “Incorrectness” – a term that might cause scholars of early modern English to shudder, but which serves a function in the Creole of literary scholar-computer scientist interaction – is measured by what in this same argot were deemed “not-words”: words not in a standard-length abridged dictionary.
-
Supplement to the OED
The aforementioned discoveries make VEP’s data serve yet another purpose: it does the work of a historical dictionary, like the Oxford English Dictionary (OED), by helping to locate the first known occurrence of a word in print. Because it is systematically generated taking into account more books as our corpus size increases, it has a basis in the total output of print in English that a human could not produce. Having an automatically generated dictionary from 1470 to 1800 with each word indexed and date stamped does part of the work that the OED’s creators so desired. The frequency with which scholars have recourse to the OED as the ultimate source of first word usage, and the increasing realization that the OED is an imperfect tool for doing this makes data curation and organization at scale the contribution our work will make for humanities scholars who never become interested in doing digital humanities themselves.
-
Explaining Texts
Explaining texts is where data curation relies the most on VEP’s visualization tools. VEP’s existing and future tools depend on text tagging. From a computer science or mathematical point of view, tagging enables turning words and associated information into numerical vectors that can be compared, manipulated, and categorized. Our pilot year has revealed that tagging methods of various sorts obey similar rules and that the value of a particular schema for tag-generation is its intelligibility to end users. In other words, to simplify a bit, we have learned that randomly generated tags (tags generated by a computer’s assigning words to groups based on no information by a random number generator) can produce the same separations among data that we can see when using human developed tagging schemes like that of Docuscope. Shock is the humanities scholar’s response to the statistical fact that as long as the number of tags in the dataset exceeds the number of elements, the ability for the tagging scheme to produce a useful separation of data has probability one (in most cases), regardless of what the tagging scheme is. While this may on its surface seem like a flaw of tagging methods, suggesting that “anything goes,” statistical learning theory has long shown that this is, in fact, not a fault of tagging schemes but rather a strength. (See, for example, V. Vapnik and A. Chervonenkis. “On the uniform convergence of relative frequencies of events to their probabilities.” Theory of Probability and its Applications, 16(2):264–280, 1971.) However, what the Vapnik-Chervonenkis system does not explain is that not all schema are created equal in terms of explanatory power. The user or his software can devise and choose among tagging schema based on their explanatory capacity. Thus, our tagging engine can use any system that is meaningful to a user group (part of speech, rhetorical categories, genre, normalized word occurrence, and the like) in order to generate visualizations that can then be explained in terms familiar to that group.
-
-
Planned Artifacts: Supporting the Scholarly Workflow
The good ideas we develop over the course of the project mainly have value if they are embodied in an implementation that we can make available to the broader community. Selfishly, such an implementation is required so that we can use the tools to prove their value. But at a grander scale, only by making our new approach broadly and easily available can we maximize its impact: we need to allow the scholarly community to reproduce our results, and to make discoveries of their own without having to re-implement our ideas.
Our plan is to build an integrated suite of web-deployable tools that can both be made available as open-source software, as well as provided as a web-served resource. Integration and flexibility are our key design goals. We intend to provide data management, for curating large corpora of texts as well as tracking the intermediate analyses performed by the community of users, by supporting a centralized database, in addition to allowing users to work privately. The centralized database will provide the flexibility of allowing users to work with standardized collections, or to define their own subsets or personal corpora.
The main components of the system include a data management and curation back-end, text quantification (including a tagger), text viewing (including connections to analytics and corpora level search), mathematical analytic tools (including both traditional statistical tools, as well as those based on our new ideas), and visualization tools. Integration will allow for more productive workflows, and tracking of provenance information to insure reproducibility. However, we will also allow for users to retrieve all data in standard formats so they can easily apply external tools.
The tool package we will develop over the next three years is the VEP Multitext Analyzer, which takes in the strengths of what we had proposed and what we designed, discovered, and discarded in the pilot year. Screenshot prototypes appear below. Its function is to allow various text tagging-schemes to be attached to a set of data and that data to be viewed in many different ways,. Flexibility and tailorability are crucial to its portability to different datasets and to different technologies: a mobile app version and a web version are both within the planned scope of work, as well as APIs that allow other software packages to interact with the VEP MultiText Analysis engine.
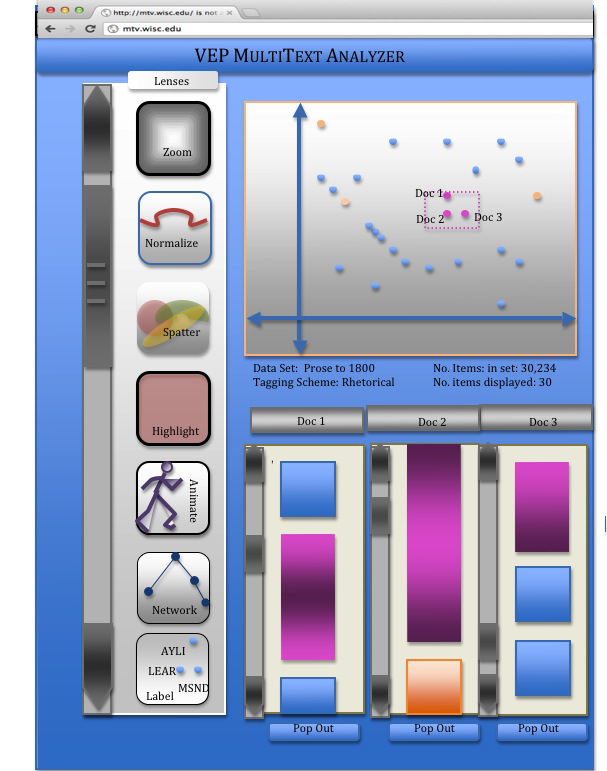
Figure 10: Rendering of the VEP MultiText Analyzer with lenses to overlay on the graph of the corpus to emphasize different statistical properties of the data. Using a mouse to select a subset of documents that seem to form a cluster creates a visual abstraction of these texts as blocked regions of similarity. Each of these can be popped out so that the individual texts can be viewed and navigated in parallel.
Users can load their own data or use pre-prepared representative data sets, such as our 1000-book 1470-1800 corpus. The user can visualize data in a range of ways and zoom in on or modify ranges of this data using a series of lenses. The lenses allow the data to be reviewed with different emphases including but not limited to the following: emphasizing or highlighting a particular rhetorical feature, viewing the animated progression of changes in qualities of texts such as vocabulary over time, the relationship of a single work to others, the drawing of edge networks that incorporate known information about texts and interpolate absent information, as well as a range of other features.
Our tools will provide the user with facilities for interactively creating maps, as well as defining distance metrics that can be used in a variety of ways. Besides their utility in map creation, defined metrics may be applied to perform clustering or simply queried to perform similarity searches. While clustering and similarity search are already central to computational literary study, the ability to incorporate user-designed metrics will imbue them with new power. Our system will couple them with best-practice visualization tools, and custom-tailored visual techniques.
Further, the software needs to include nearest-neighbor calculations and visualizations: if a user chooses a single text, he or she may then want to see on the graph or as text the texts that are most like that text. K-nearest-neighbor techniques or k-clustering turn out, in our domain, to be closely related to search. Thus we need to implement various search techniques, including ones based on an index of data, ones that look more like a standard search engine, and methods of visual search. For example, if a user wanted to know the ten nearest neighbors of Paradise Lost, he or she could specify the initial metric that determines distance. One possibility would be to choose a metric that specifies that if two texts share words relatively uncommon in the database at a higher rate than any other text paired with Paradise Lost, the second text is the nearest neighbor of the first. This is repeated k times to find the k-nearest neighbors. Alternatively, the user could search for the point on a graph that represents Paradise Lost, and highlight the region around it to discover what texts are the nearest neighbors. At this point, the user will often want to see the neighboring texts with the reasons for counting two things as similar marked.
We plan to include in our tools more standard text utilities as well, including full-text search, meta-data search, and version control with differencing.
-
Distribution of Software and Methods
Our aim is to produce tools that humanist scholars will want and be able to use. A key part of the pilot year has seen members of the team interacting with humanist scholars to establish ways in which we can not only deliver tools in a workable form, but ensure that humanists use the tools. During the pilot year, these distribution channels included university seminars and sessions at the Globe Theatre; TextLab at Strathclyde; and experiments with making Docuscope public to a limited panel of potential users. We do not want to downplay the difficulty of communicating the responsible use of statistics to study print culture; this is a serious part of work going forward.
The website that will be completed by the end of the NCE period of the initial grant will allow for detailed documentation of methods, as well as quick tutorials so scholars can jump in and try the software immediately. Publication, blogs, word of mouth, conference appearances – the currently standard means of distribution – are our key methods of teaching the principles of scale and the use of our software.
Our group is committed to the idea of open source software for this project. An open source project goes beyond just making the software available: it includes the idea of involving the community in the development. Open source is important to this project for a number of reasons. First, the fact that users can inspect the software allows them to understand what it is doing at a detailed level that may be required for its use in a scientific discourse. Second, the fact that it is freely available means that others can use it for their own purposes, or to re-create results. Third, the community aspects of open source provide insurance of the software’s sustainability, even if the original authors no longer have the resources to continue their work.
Sustainability Beyond the Grant Period
During the length of the grant the data will be maintained directly by the researchers and made available via their website when appropriate. We are in talks with Memorial Library for the long-term preservation and storage of our data and work product, as part of its new initiatives for maintaining such scholarly output.
The team’s code is open-source, and its software will be made freely available. The team is investing resources in careful documentation of its work during the grant period. Thus, the long-term maintenance of the code will do what all sustained, non-commercial software does: it relies on the community of users to perpetuate the software. We are hard pressed to find an example of any useful and usable software that is not commercial or monetized that is not supported and maintained in this way when there are users who remain interested. (Linux and R are two prime examples.)
Intellectual Property
It is our goal that all software we develop be open source. We specifically aim to be able to release all software that we develop under a flexible, non-restrictive open-source license such as the BSD license, the LGPL, license, or an OSI attribution license. Non-software deliverables may be released under a Creative Commons license. Making our software available in such manners often requires a sacrifice: many of the components that we may prefer to use are incompatible with these licenses. For example, if we use components that are licensed to us using a GPL open source license, our rights to distribute our results may be limited. Our team will work to balance this tradeoff between flexibility to use the best possible components and produce the best quality results and having the ability to release code under the most unrestrictive terms. (Because this balancing act is ongoing, it is premature to declare which of the open-source licensing schemes we will use.)
The software that VEP develops will be open source. We will release the MultiText Analyzer and its component and related parts under an appropriate license, as in the grant year proposal.
For the pilot grant, the University of Wisconsin-Madison Libraries provided its existing agreement for the use of EECO, EEBO, Evans and TCP texts. These terms have not changed. UW Library staff (Peter Gorman) has established with the content-providers that planned VEP uses of the texts do not violate any licensing agreements on the grounds of acceptable scholarly use and the status of these books’ content as part of the public domain. (Please see VEP pilot grant application for supporting documentation.) We can use the texts from these sources for research and make portions of them available through our software, as long as they are stripped of proprietary markup language (or metadata) and without making it possible for the user to download the full database. Our project does not use or plan to use the page images or markup information (metadata) in any way, as NINES and 18thCONNECT do.
Support
Support of our current and new software beyond the three-year grant period proposed herein is projected to come from two sources. Human support for the software during its development and for a short time thereafter will be the task of the investigators, including faculty and graduate students. Thereafter, responsibility for support will move to Memorial Library’s technology division, currently under the able leadership of Lee Konrad, with Carrie Roy as lead liaison to the digital humanities community, and whose technical work is led by Peter Gorman, Scott Prater, and Bruce Barton. Memorial Library’s investment in digital work through the new Humanities Research Bridge, supported financially by the library and the university at large, and additional initiatives interlocks closely with VEP’s goals.
Table of Current and Projected Software Development and Dependencies
The row that is of most relevance to the novelty of this proposal is the one labelled “B. Multi-Text Analyzer.”
DSJ, TextViewer, and the Explainers module (rows A, F, and I) are the technologies developed in the pilot year that will be the skeleton of our new omnibus tool, Multi-Text Analyzer. The corpora created in the pilot year will remain available online as new corpora are added; as VEP’s website goes live before January 2013, there will be easy, consistent links to these and other parts of the software. Corpus Separator, Single Text Viewer, and TextDNA (rows C, E, and G) are standalone programs that will not be modified as such, but whose techniques will be incorporated by the more powerful, web program, MTA.
TABLE OF INFORMATION
Work Plan
To make the work plan clearer with respect to what has already been accomplished we begin with the state at the end of the pilot year (in the same format as other years will be presented), and include the no-cost-extension year in the plan.
By “proof-of-concept” software, we mean limited demonstrations (e.g. where the developer can show that the system works). By “prototype” software we mean software that is complete enough (and constructed in a way) that it can be tested by group members.
-
Pilot Year (9/1/2011-8/31-2012)
Key Milestones (current state):
-
New text-tagger prototype (DSJ) with proof of concept of interchangeable dictionaries and web deployment. Proof-of-concept prototypes are not deployable to potential users.
-
Experiments with word-spotting quantification (using existing text analysis software and databases, and re-purposed genetics tools).
-
Use of pre-existing text visualization tools and initial designs for a text-viewer.
-
Assembly of initial test-corpora.
-
Initial experiments with explainers, including proof-of-concept demonstrations on small datasets.
-
Explorations of using standard statistical packages to explore tagged text data.
-
-
No-Cost-Extension Phase (9/1/2012-6/30/2013)
In the no-cost extension phase of the pilot project, we will evolve many of the proof-of-concept works to provide demonstrations at larger scales and to provide more complete designs and testable prototypes.
Key Milestones (to be completed before 6/30/2013):
-
Prototype, web-based text-tagger, with basic interchangeable dictionaries.
Gleicher
-
Design and proof-of-concept of more general text-tagger, including formalization of tagging architectures and design studies of dictionary design schemes.
All senior researchers and graduate students
-
Proof-of-concept and initial design of a centralized-database, integrated analytics platform. Initial prototype on a small, fixed corpus. A key task is a “requirements analysis” to decide what we want from the system.
Gleicher, Valenza
-
Development of explainers mathematics to allow for proof-of-concept demonstrations on 1000-text corpora.
Gleicher, statistics and math consultants
-
Proof-of-concept of metric learning and layout concepts that show creating 2D maps from corpora.
CS team
-
Refinement of work using standard statistical software on text data to understand how to best translate from statistics to literary scholarship.
Gleicher, Valenza, Witmore, Hope
-
Prototype text visualization tool that integrates with on-line analytics and explainers.
Visualization Graduate Student
-
Perceptual experiments to inform the design of text-visualization tools.
Experiment designed by graduate student, deployed to local users and via Amazon Turk
-
Website explaining the group’s work, and making software available as possible
Valenza with assistance from Carrie Roy
-
Papers prepared for publication and presentation in high-level for a
Valenza, deRose, Gleicher, Witmore, Hope
-
Additional Curated Data sets
Valenza, Burkert, SeefeltLeisture
-
-
First Year (7/1/2013 – 6/30/2014)
At the end of the no cost-extension phase, we should have initial designs and/or basic prototypes for all of the major components of the project. In the first year of the new project, we will focus on building these ideas into testable prototypes that work at larger scales. At the end of this year, our goal is to have sufficient prototypes to experiment with large scale text analysis so that we can understand the issues in providing them more broadly. Basically, in year one, we will move from prototypes of concepts to prototypes of systems.
In the first year, we will also seek to have externally deployable versions of some of the basic tools so that we can begin to engage the community, as well as get a sense of the degree of support we will need to provide.
Key Milestones:
-
Have an externally-deployable, web-based text tagger that we can promote to encourage the broader community of scholars to begin to experiment with this kind of analysis.
All senior researchers.
We have a version of this already working. The next step is for our humanities researchers to work with it extensively, provide feedback to the developers, and repeat this cycle as often as necessary.
-
Document best-practices for the use of statistical tools with tagged text-data.
All: This begins with working with the prototypes we have
Designed or mocked up, analyzing strengths and weaknesses, and then documenting what we have learned. Each party will contribute his or her strength to this process: design, programming, reverse-engineering, question-asking, writing, documenting. Then these results will be fed back into the next phase of development and repeat.
-
Prototype tools for tag dictionary creation, including designing ways to integrate word-spotting and tagging styles of quantification, as well as to design ways of specifying more general tagging schemes.
All in consultation. “All” here denotes academics that have expressed and continue to express interest, for example teams at UIUC, Nebraska, Texas A&M, Stanford, Tufts, and Berkeley, as well as students at UW-Madison and elsewhere who have self-identified as interested in contributing to these efforts.
-
Build a prototype analytics platform, based around a centralized database for corpora and analytics results. Demonstrations of key features such as version and provenance management, integrated analytics, annotation sharing, user-defined sub-sets (“subcorpora”), web interfaces for text viewing and result sharing, etc.
Graduate student (yet to be hired)
-
Prototype the integration of text search and modernization components into the web-based, database-centric analytics platform.
Graduate students, Valenza
-
Prototype text visualization tools that integrate with analytics to provide for multi-scale zooming from corpus-level patterns to individual exemplar passages (and back).
Senior humanists have described their desiderata for such software; it now falls to the programmers to translate this into workable code, at which point the code will be tried in alpha form by the researchers, feedback provided to the programmers, and so on. This is a crucial cycle to the project; in the past, it has been where our best ideas have arisen.
-
Prototype the use of explainers in the web-based analytics platform, considering the use of making them available to people who are not familiar with machine learning methods. Continued development of the methods of the concept to improve their scalability and usability.
Humanities researchers describe to the programmers what metadata they have generated or could generate. Conversations with the programmers will refine what these categories could be; the humanities staff generates documents in a form that works; a rapid prototype is developed, and the cycle repeats.
-
Proof-of-concept layout and metric design tools, including experimentation with the ramifications of improved metrics on tasks such as nearest-neighbor search and classification.
Gleicher and CS students
-
Perceptual and usability experiments to inform the design of visualizations.
Graduate students using Amazon Turk and local parties with standing interests, including senior researchers and graduate students
-
Proof-of-concept development of multiple-text visualization tools.
This requires IRB approval (already gained), and the distribution of the software well beyond the research team at Wisconsin.
-
Preparation of materials for publication
Valenza, Hope
-
Preparation of larger datasets, including increased mixing of clean and dirty OCR data
Valenza-led
-
-
Second Year (7/1/2014-6/30/2015)
At the end of the first year, we will have initial prototypes of the actual kinds of systems we envision creating as part of the project. In the second year, we will enhance these prototypes by using them, and iterating their designs based on feedback, as well as by confronting the issues of scaling them to even larger corpora.
As our systems become better able to scale to larger corpora (both in terms of the engineering to provide performance, as well as interfaces that allow users to work with larger amounts of data), our need to create and curate these larger corpora will become a central aspect of the project. Finally, as we use the prototypes within our group, we will become confident enough in their stability and utility to begin providing them to others. This should provide us with even more feedback for design iterations and improvements.
Key Milestones:
-
External deployment of an integrated, web-based analytics platform running on a fixed (but moderate scale) corpus. Evangelism and outreach to engage the community in using these tools. Substantial testing and documentation efforts are required such that the tools can be provided open-source, and have sufficient disclosure of their methods that they can be used in a scholar’s process.
All, depending on skill sets
-
Prototypes to scale to corpora at increasing scale. By first confronting the issue of providing the computational performance on the server, we can have a “back-end” that will allow us to consider the scalability of the visualization methods.
CS graduate students and Gleicher
-
Prototypes of the metric learning and layout tools, enabling iterative refinement through their use within the group.
CS graduate students
-
Prototypes of explainers techniques to understand the issues of robustness, scalability, and reliability for widespread deployment.
Gleicher, Valenza, graduate students
-
Prototypes that allow various types of quantification (e.g. word-spotting and different types of tagging) to be used together.
This requires combining existing elements of the software; each member will draw on his or her own strengths in designing and testing prototypes.
-
Assembly of corpora with tens of thousands of texts, and proof-of-concept analyses performed at these scales.
Valenza and humanities graduate students; Gleicher and CS graduate students
-
Iterative refinement of the analytics platform through its application to real scholarly questions, analysis of these case-studies, and improvements to the system.
All researchers, based on expertise.
-
Prototype multiple text visualization tools, integrated into the analytics platform, combining small-scale comparison of texts with corpora-to-passage zooming.
The computer programmers will generate the prototypes, put them into the hands of the humanists rapidly, who will test and give feedback.
-
Preparation of materials for publication
Valenza, Hope
-
Preparation of larger datasets, including increased mixing of clean and dirty OCR data
Valenza + graduate students
-
Design and implementation of semi-supervised methods for improving datasets
All researchers, based on expertise
-
-
Third Year (7/1/2015 – 6/30/2016)
In the final year of the project, we will confront the several different types of scale: scaling to larger corpora of texts, scaling to larger user communities, and scaling to more complex analyses.
Scaling to larger corpora will force us to confront the assembly and curation issues, the variability of text quality within a corpora (since a larger corpora will be unlikely to be of uniform quality). It will force us to understand the computation and storage issues in providing performance at these scales. It will force us to consider the design of visual presentations of larger scale results.
Scaling to a larger community will require us to make our tools sufficiently well-documented and robust that we can make wide-scale releases. It will force us to consider how to evangelize and support the community that will use them. It will force us to understand modern ways of providing services, such as using the “cloud” in ways that individuals can obtain access to the resources they need without purchasing them.
Scaling to more complex analyses will force us to re-consider the mathematical tools of explainers and metrics. Not only must these tools scale to perform on larger corpora, but they must also be able to capture and explain the more complex relationships that might be found.
We emphasize that it is difficult to predict the kinds of underlying technology for wide-spread deployment that will be viable in 2016. Already, the idea of buying servers to host web applications seems quaint as cloud services allow resources to be made available on an as-needed basis without the large capital expenditures and maintenance of owning physical hardware. By providing our systems as cloud-based applications, we can allow users to access the amount of resources they need, and have the amount of resources scale elastically based on needs. Similarly, emerging social media platforms may provide even more effective ways to publish, evangelize, and support software as a community effort.
Key tasks:
-
Documentation and testing of the systems build to allow for their open-source release and public deployment. Testing requires providing a proper suite of regression tests such that future versions of the software can be validated, which is important to make sure scholarly results are reproducible.
Design of the regression tests will be Gleicher’s responsibility; implementation and analysis will fall to graduate student researchers and other senior faculty.
-
Making all software available through an open source release.
Valenza will take charge of the website and downloadable components; others will support as needed.
-
Making the main pieces of the project available as a web service, on as large a corpus as can be supported reasonably.
Gleicher and graduate students
-
Assembly of massive corpora for further experiments.
Valenza with library consultation
-
Prototypes of tools for large corpus curation including data consistency visualizations.
Gleicher and Graduate students
-
Showcase analyses demonstrating how we have used the tools and data sets to make discoveries
Valenza, Hope, Witmore
-
Exploration of cloud (or whatever comes after that) –based deployment strategies.
All in conversation the with libraries and DoIT, organizations with more experience than VEP has in moving towards scale.
-
Establishing an open-source community around the software.
Hope, Valenza, Witmore
-
Prototypes of new visualization and analytics tools based on the experience of performing massive scale analyses.
The Researchers and the World Whom We’ve Inspired
-
Preparation of materials for publication
Valenza, Hope, + humanities grad students
-
Preparation of larger datasets
Valenza + humanities grad students
-
Teaching other potential users to design smart datasets
Valenza + humanities graduate students
-
Deliverables
The project’s deliverables will include but not be limited to the following:
-
Multiple Curated datasets ranging in size from 1000 to 100,000 books from 1470 to 1800.
-
Automated techniques for choosing and curating datasets and the software used to create this process.
-
Documentation either in written or video (or both) form for using the software created.
-
MultiText Analyzer and any component parts that can be used independently of the Analyzer.
-
Publications in the forms of articles, conference proceedings, blogs, and other academically-respected means of sharing research results.
-
Access to the group’s work-product: a set of files generated along the way that demonstrates experimental results, even those not used in publications.
-
Probable additional software generated while working on the grant associated with the above aims. Details about many of these deliverables are outlined in the table that appears in section I.
Glossary
This glossary contains a few key terms used in this document that benefit from further clarification.
-
Dendrogram – a tree diagram used to represent hierarchical clustering. The tree branches at nodes and ends in leaves, which are nodes of a special type: they contain no children. Many algorithms may be used to generate the hierarchies that are then used to form the tree. In general, the more branches that need to be traversed to connect two nodes of the tree, the more different those two nodes are.
-
Docuscope – a proprietary text analysis environment with a suite of interactive visualization tools for corpus-based rhetorical analysis, developed at Carnegie Mellon University over a decade ago and in use in some domains.
-
Euclidian distance – the length of the line segment connecting two points. In spaces of higher dimension than two, this may be more easily thought of as the Pythagorean distance between two points.
-
LATtice –a visualization program, written by Dr. Anupam Basu, that pairs with Docuscope results to allow the user to see more about the categories that characterize a document or set of documents through a series of heatmaps.
-
Semi-supervised learning – a computer program learns to label data by using some human-labeled data and then generalizing from that data to learn additional information from a set of unlabeled data.
-
Means, or K-Means, clustering – a method of analysis that seeks to partition observations into a set number of groups, say “k,” in which each observation belongs to the cluster whose mean is nearest to the observation’s value. This is a hard, non-deterministic algorithm, meaning that there is usually no single solution and the finding of good solutions requires considerable time. However, there are effective, heuristic algorithms that can give good, approximate answers in a short time, making the technique fast and useful under many conditions.
-
Principal Components Analysis – A mathematical procedure that reduces the complexity of a set of potentially correlated observations into a set of linearly uncorrelated variables, through orthogonal transformations of the original observations using eigenvectors. The number of new uncorrelated variables – the principal components generated – is less than or equal to the original number of original observations. The principal components are ranked such that the lower the number of the principal component, the more variance (or the more information) in the original set it captures. The first principal component contains the most information about the differences among each of the original measurements. Each succeeding principal component (2nd, 3rd, 4th, up to the original number of observations) contains the next most variance. PCA assumes that the original data has a joint (or multivariate) normal distribution, in other words, it assumes that the data has the multidimensional equivalent of a normal distribution in two-dimensional space. Principal Components Analysis allows the simplification of data such that many dimensions can reasonably be approximated visually as two or perpendicular dimensions (like an x and y axis) that show the greatest amount of information about the distribution of the data.
This procedure generally requires the work of a computer, and although many statistical programs have it as one of their standard functions, it is not necessarily well understood by users.
-
VARD 2 – “an interactive piece of software produced…designed to assist users of historical corpora in dealing with spelling variation, particularly in [Early Modern English] texts. The tool is intended to be a pre-processor to other corpus linguistic tools such as keyword analysis, collocations and annotation (e.g. POS and semantic tagging), the aim being to improve the accuracy of these tools.
The VARD 2 software uses techniques derived from modern spell checkers to find candidate modern form replacements for spelling variants found within historical texts. The user can choose to process texts manually, selecting a candidate replacement offered by the system; automatically, allowing the system to use the best candidate replacement found; or semi-automatically, training the tool on a sample of the corpora.” http://www.comp.lancs.ac.uk/~barona/vard2/
-
2D layout – Any of the methods used to reduce many-dimensional mathematical space to two dimensions for humans to interpret mathematical data visually.