This is an old version of the page!
Please refer to https://pages.graphics.cs.wisc.edu/BoxerDocs/ for a more recent and complete version.
User Guide: Description of Views
Overview of Boxer Views
Boxer features a number of different views that provide often needed arrangements of boxes useful in performing classifier comparison. This part will provide you with an overview of the views in Boxer. You will learn the basic uses of each view.
To add a view to the workspace, use the Views dropdown in the right panel of Boxer’s window. It is below the “filters” panel. To see examples of how the views are used in analysis scenarios, see the use cases.
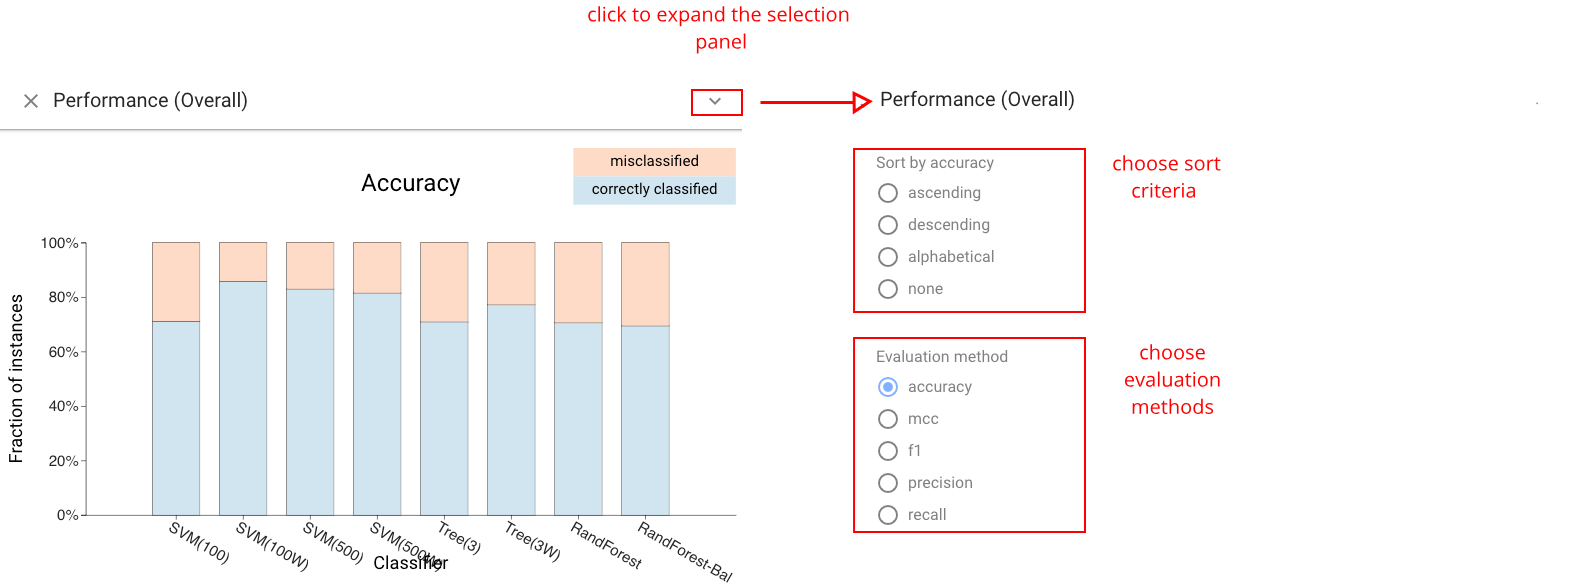
Classifier Performance View
The Classifier Performance view: shows the performance of each classifier in a stacked bar. A variety of metrics can be chosen. For metrics that are ratios of subset counts (e.g., accuracy, precision, and recall), the bars are stacks of boxes. This view provides a simple overview of classifier performance, and an easy way to select sets of instances (e.g., what classifier predicts correctly). The view allows sorting by value to facilitate identification and comparison of the best or worst classifiers.
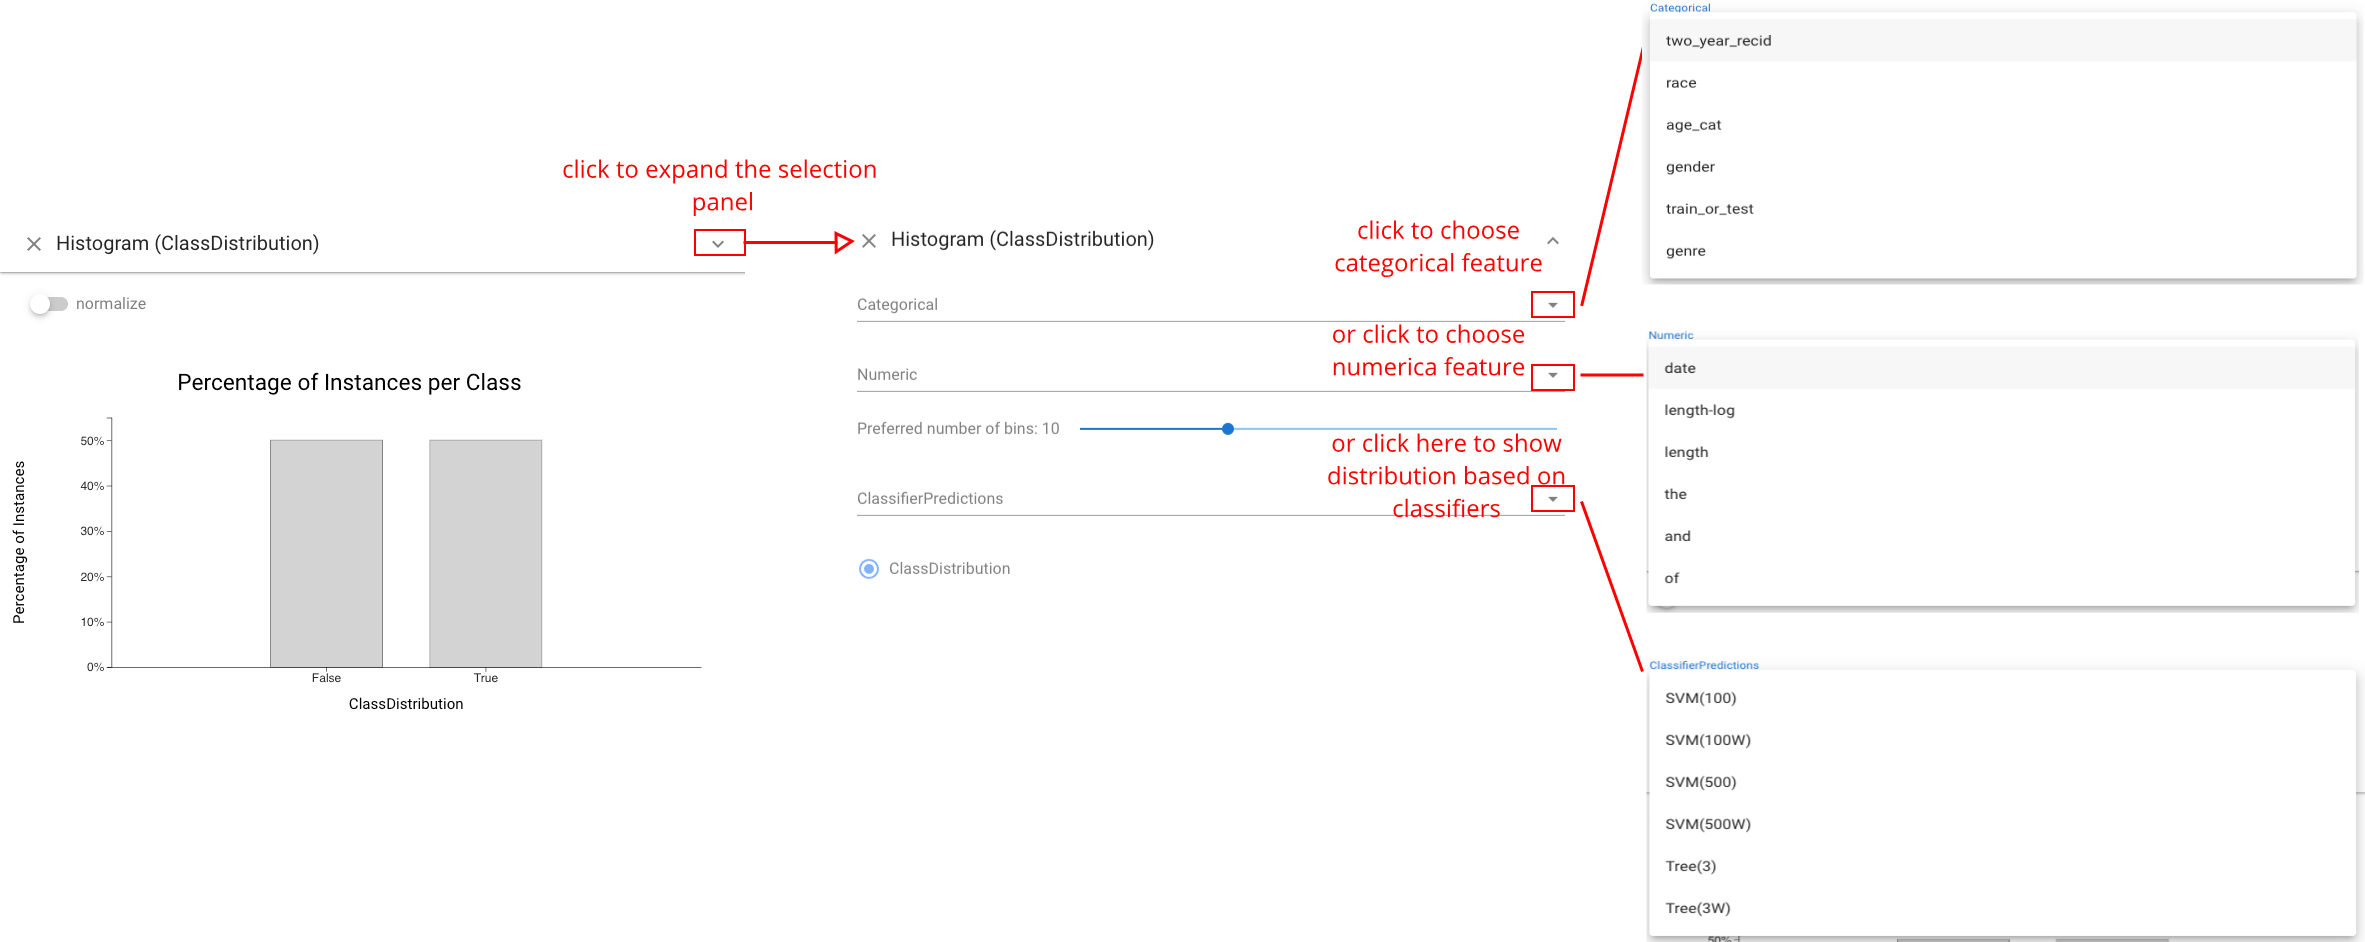
Histogram View
The Histogram view shows the distribution of the data across a feature. This includes the data features as well as the actual and predicted classes. Users can choose to show different distributions. Continuous features are bucketed, and categorical features can also be chosen. Histograms provide an important mechanism for selection as well as comparative display, as bars serve as boxes.
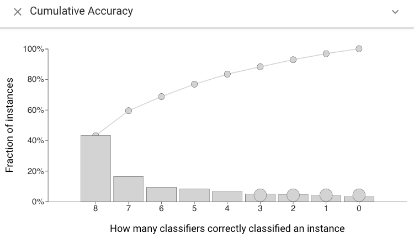
Cumulative Accuracy view
The Cumulative Accuracy view shows how many classifiers correctly labeled each data instance. This view can be used to select challenging instances, or to see if a selected set contains easy items.
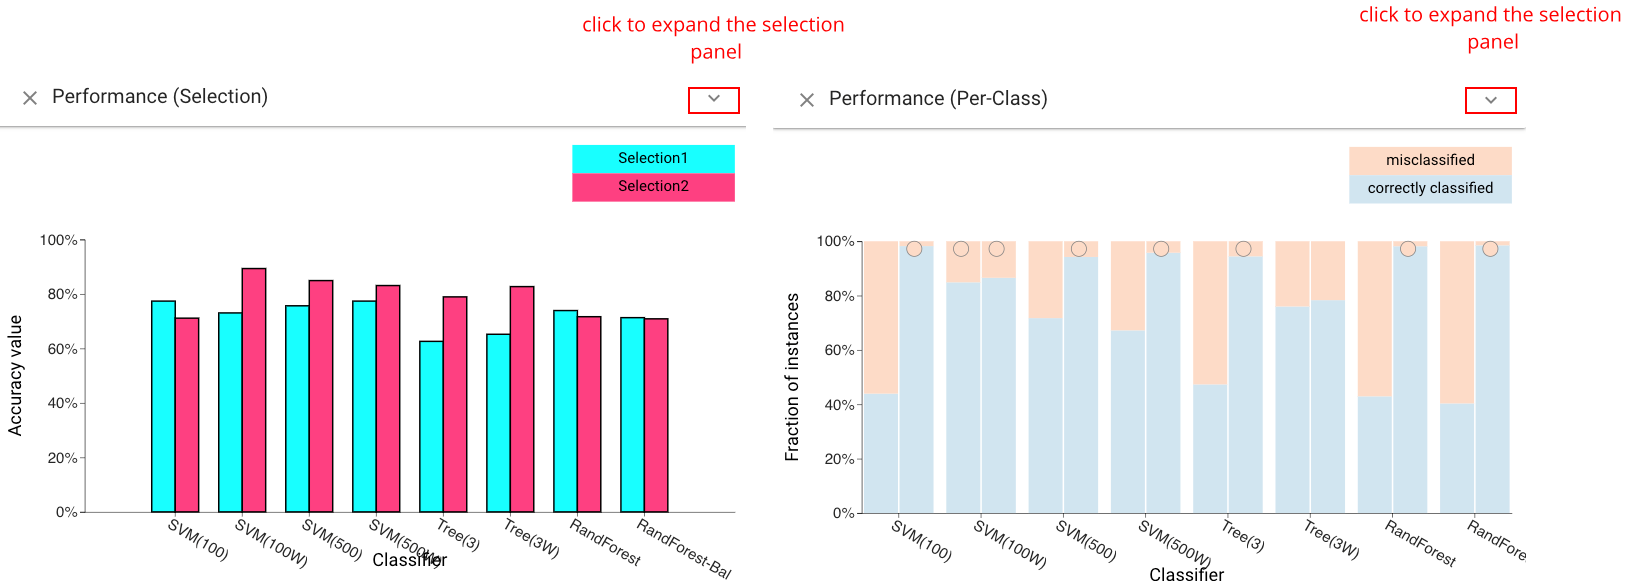
Selection and Per-Class Performance Views
The Selection Performance view (left) shows the performance of each classifier across both selections. A variety of different metrics can be chosen (accuracy, F1, etc.). The *Per-Class Performance view& (right) shows the performance of each classifier for each of the actual classes of the instances.
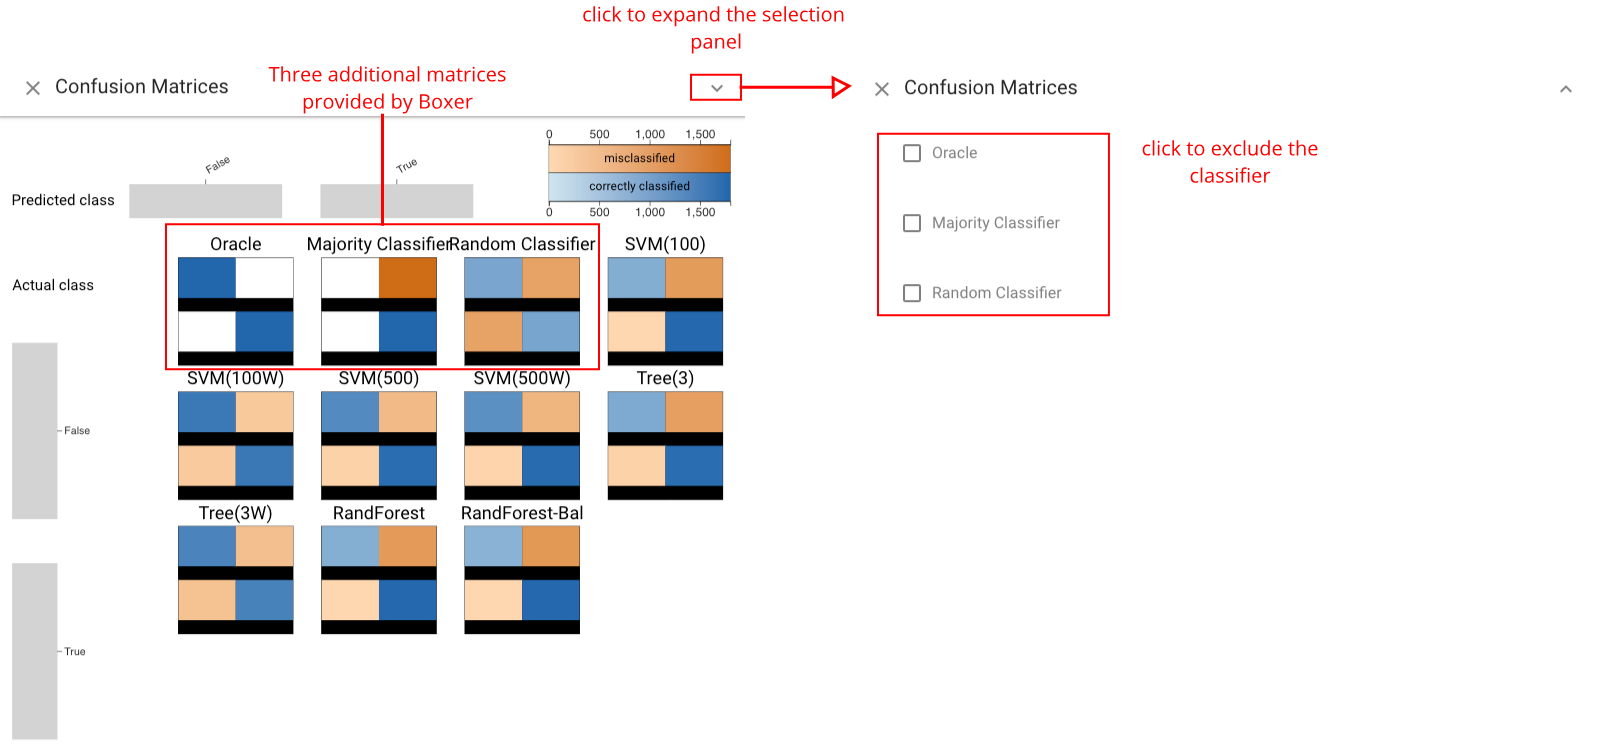
Confusion Matrix Grid View
The Confusion Matrix Grid view provides the standard view of classification results for each classifier. It can be used to compare classifiers based on their prediction profile per class. Three additional matrices are also provided by Boxer and serve as a comparison baseline: the oracle, shows the performance of a perfect classifier; the majority classifier, predicts the majority class in the dataset; the random classifier, predicts a random class for each instance.
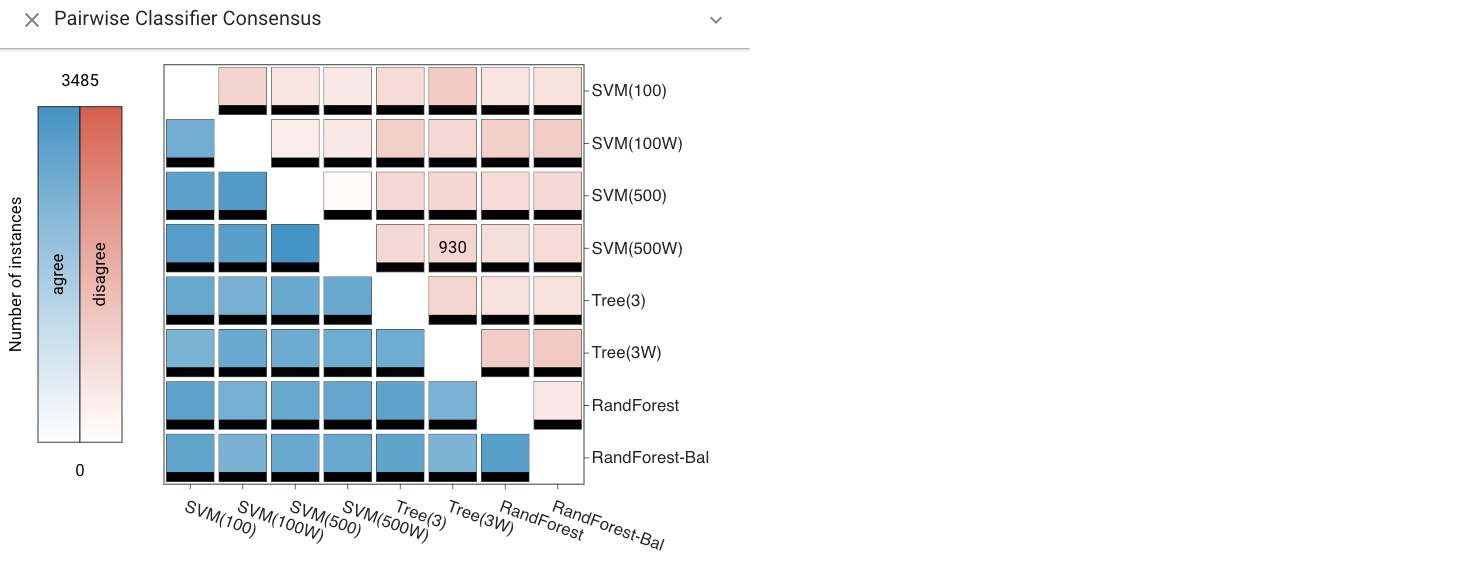
Pairwise Consensus View
The Pairwise Consensus view shows the agreement and disagreement between each pair of classifiers as a matrix. It conveys the number of instances for which two classifiers predict the same label. The matrix is split on the diagonal to distinguish agreement on correct vs. incorrect instances. This view can be used to identify correlations between classifiers.
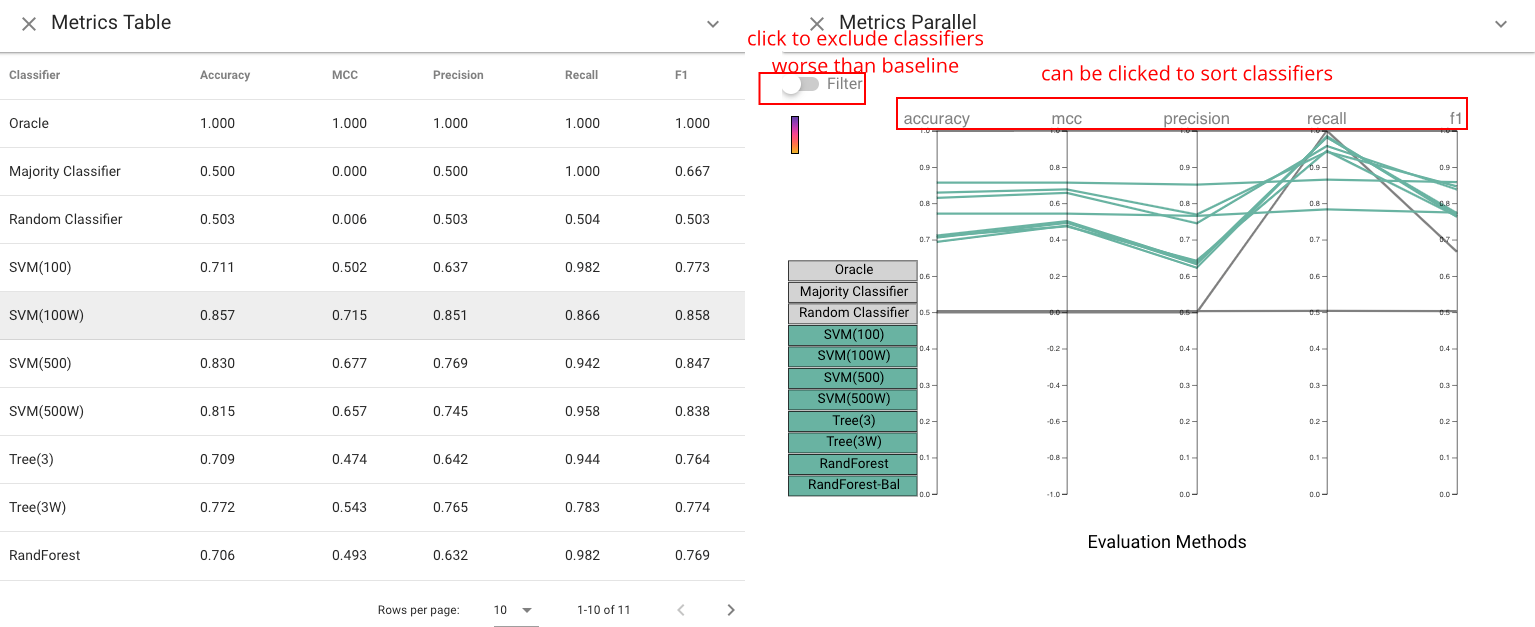
Standard Metrics and Parallel Metrics Views
The Standard Metrics view and Parallel Metrics view provide overall statistics about the classifiers. The Standard Metrics view (left) provides a simple table of many metrics across all classifiers. The Parallel Metrics view (right) presents the same information in a parallel coordinates chart, which can identify correlation between metrics.
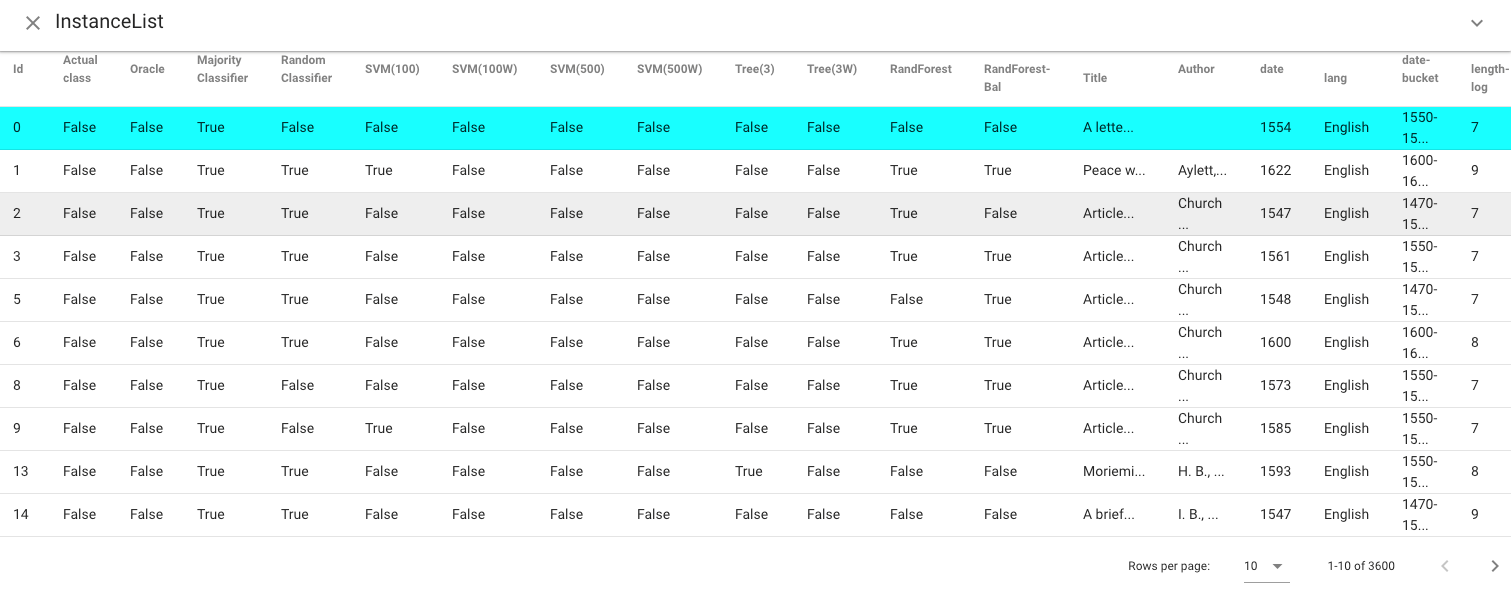
Instance List View
The Instance List view shows a tabular display of the instances in the active selections. Instances are color-coded to indicate which selections they are part of. Single instances can be selected as the selection in this view, which allows for fine-grained, instance-level modification of selections.
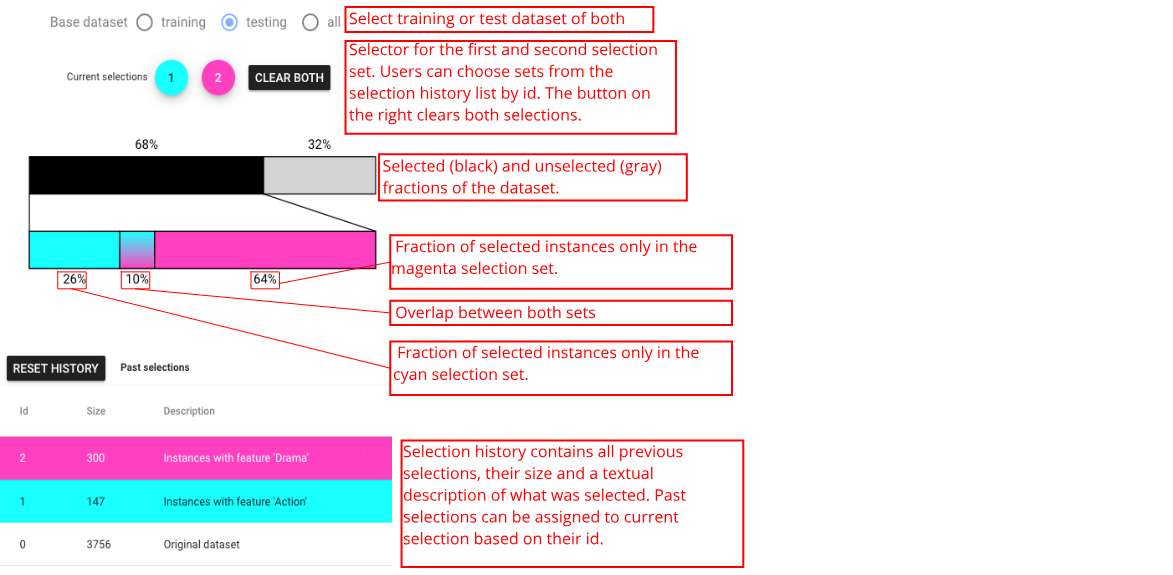
Selection Controls Panel
The Selection Controls panel can support selection display and interaction, as well as allows users to switch between training set, selection set, or both. Selection is a subset of instances of interest to the user. In Boxer, boxes serve to create selections (e.g., clicking on a box sets the active selection), and the active selection can be presented visually in each box to enable comparison by showing the intersection between the box and the selection. The left and right mouse buttons are used to make the first and second selections separately. Consistent coloring is used throughout the interface: cyan represents the first active selection, magenta the second.